What Household Income Is Top 10%, 5% or 1%? (2025 Data)
The family income it takes to reach the top 10%, 5% and 1% in the Fed's 2025 survey, overall and by age, the median by age, and what counts as income.
Money··10 min read
In the Federal Reserve's 2025 Survey of Consumer Finances, a US family needed about $252,600 of income before tax to be in the top 10%, about $400,500 for the top 5%, and about $1.15 million for the top 1%. The median, the family in the middle, earned $82,200 (Federal Reserve Bulletin, October 2026, Table 1).
Two details matter before you hold your own number up against those. They're for a whole household, not one person. And they're for income earned in 2024, the year before the survey, expressed in 2025 dollars. Below: the cut-offs by age, the median by age, what the survey counts as income, and why the same paycheck ranks differently at 30 and at 50.
The income percentiles for all families
The Fed publishes medians and means. For the cut-offs higher up, we worked them out from the Fed's public data file, weighting every family the way the survey does. These are the same numbers our Income Percentile Calculator uses.
| Percentile | Family income before tax |
|---|---|
| 10th | $22,600 |
| 25th | $42,100 |
| Median (50th) | $82,200 |
| 75th | $148,900 |
| 90th (top 10% from) | $252,600 |
| 95th (top 5% from) | $400,500 |
| 99th (top 1% from) | $1,150,300 |
The median in that table is the Fed's own. Our calculation from the public file gives $82,162, within a fraction of a percent: the Fed alters the public file slightly to protect the people who answered, so its figures and ours differ a little.
Look at how fast the steps grow at the top. Going from the median to the top 10% roughly triples your income. Going from the top 10% to the top 1% takes it up about four and a half times more.
The top 10%, 5% and 1% by age
The survey groups families by the age of one member, and income follows a clear life cycle: it climbs through the working years, peaks in your late forties and fifties, and falls in retirement. So the cut-offs move a lot with age (K is thousands, M is millions):
| Age | Median | Top 10% from | Top 5% from | Top 1% from |
|---|---|---|---|---|
| Under 35 | $68K | $175K | $206K | $353K |
| 35 to 44 | $97K | $240K | $355K | $882K |
| 45 to 54 | $109K | $337K | $612K | $1.59M |
| 55 to 64 | $92K | $349K | $605K | $1.98M |
| 65 to 74 | $69K | $236K | $356K | $1.31M |
| 75 and over | $67K | $248K | $373K | $915K |
| All families | $82K | $253K | $401K | $1.15M |
The medians are the Fed's (Table 1). The cut-offs are our calculation from the public data.
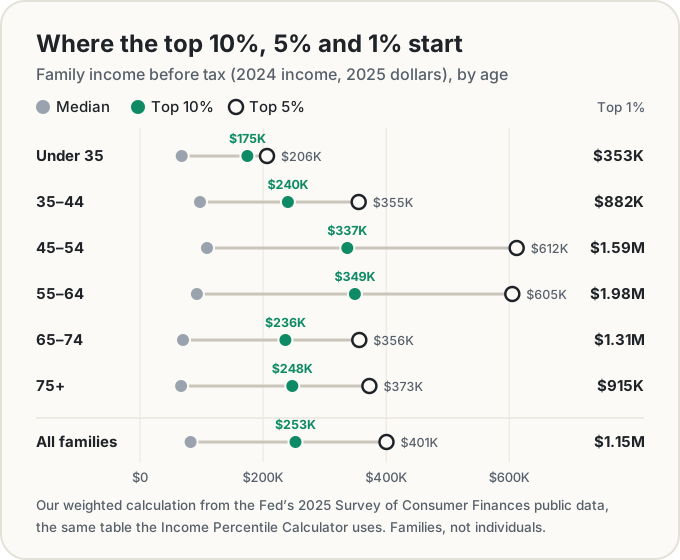
For families under 35, about $175,000 gets you into the top 10%. In the peak earning years, 45 to 64, it takes roughly twice that. The top 1% column is the shakiest number in this post, though. Within one age group it rests on a small number of interviews, and a single year's income at the very top often includes a one-off capital gain or business payout. Read it as "somewhere around", not to the dollar.
Median household income by age
Here's what the middle family in each age group earned, from the Fed's own tables, with the change since the last survey after inflation:
| Age | 2022 survey | 2025 survey | Change |
|---|---|---|---|
| Under 35 | $66,200 | $67,800 | +2% |
| 35 to 44 | $94,000 | $97,000 | +3% |
| 45 to 54 | $100,500 | $108,900 | +8% |
| 55 to 64 | $89,700 | $92,400 | +3% |
| 65 to 74 | $66,600 | $69,400 | +4% |
| 75 and over | $53,800 | $66,800 | +24% |
| All families | $76,900 | $82,200 | +7% |
The median rose in every age group. Families 75 and over gained the most, 24%. The $82,200 for all families is the highest median the survey has recorded since it began in 1989 (Fed historic tables).
The mean tells a different story. It fell 6%, to $145,200, while the median rose. That's because the drop happened at the top: the Fed says that leaving out the top 1% of earners, mean income fell only 1%. High incomes lean on capital gains and business income, which swing a lot from year to year. This is exactly why the median is the better yardstick for "what does a typical family earn". A handful of very high earners can drag the average around without changing what most families take home.
Why your percentile shifts with age
Because the age groups earn so differently, the same income lands in very different places. Take a family income of $100,000:
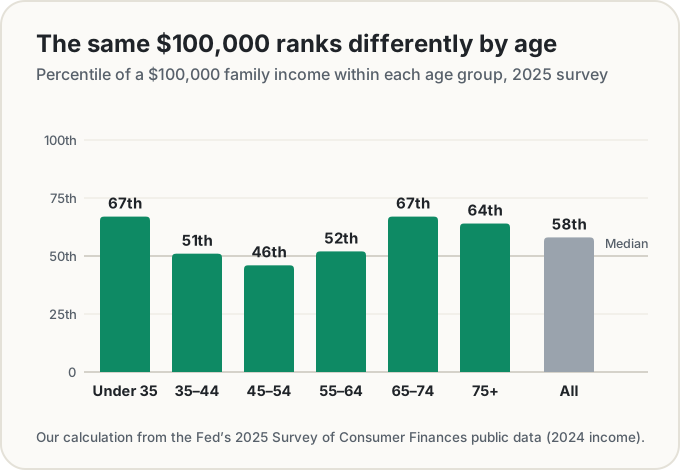
At 30, $100,000 puts a family at about the 67th percentile: ahead of two thirds of families under 35. At 50, the same $100,000 is at the 46th, just below the middle, because families aged 45 to 54 earn the most of any group. At 70 it's back up to the 67th, as wages give way to Social Security, pensions and savings.
The share of families with six-figure incomes follows the same arc: 32.6% of families under 35 earned $100,000 or more, against 53.8% at 45 to 54 and 32.9% at 65 to 74. At the top end, $250,000 is the 98th percentile under 35 and the 83rd at 45 to 54.
So if your percentile drops as you get older even though your pay went up, nothing went wrong. You moved into an age group where more people are at their peak. That's also why a ranking among "all families" can feel off. It mixes 25-year-olds starting out with 50-year-olds at the top of their careers and 80-year-olds living on Social Security.
What the survey counts as income
The Survey of Consumer Finances asks about a family's income before taxes for the whole calendar year before the interview. It adds up almost everything that would go on a tax return, plus benefits that wouldn't:
- wages and salaries, and self-employment and business income;
- interest, dividends and realized capital gains;
- Social Security, pensions and withdrawals from retirement accounts;
- unemployment insurance, food stamps and other government support;
- alimony and other support payments.
That list is from the Bulletin's footnote 6. For the 2025 survey the year is 2024, and the Fed multiplies 2024 amounts by 1.027 to put them in 2025 dollars (appendix A, Table A.1). So the closest comparison for you is last year's household income before tax, from every source.
Household, not individual. The survey's "family" is the single person or couple who run a household's finances, married or not, plus anyone who depends on them. The Fed says that's closer to what the Census Bureau calls a household. A couple on two $70,000 salaries is one family on $140,000. If you compare one salary with these tables while you share a household with a partner, you'll rank yourself lower than your household really is. If what you want is how your own pay compares with other workers, a survey of individual earnings answers that better than this one.
One unusual year. In the 2025 survey, 23% of families said their income for the year was unusually high or low compared with a normal year: a bonus, a stretch out of work, a one-off investment gain. If that's you, keep it in mind when you read your rank.
Not the Census number. The Census Bureau publishes its own median household income from a different, larger survey with its own questions. The two are close but not the same, so don't mix figures from the two sources in one comparison.
Check your own percentile
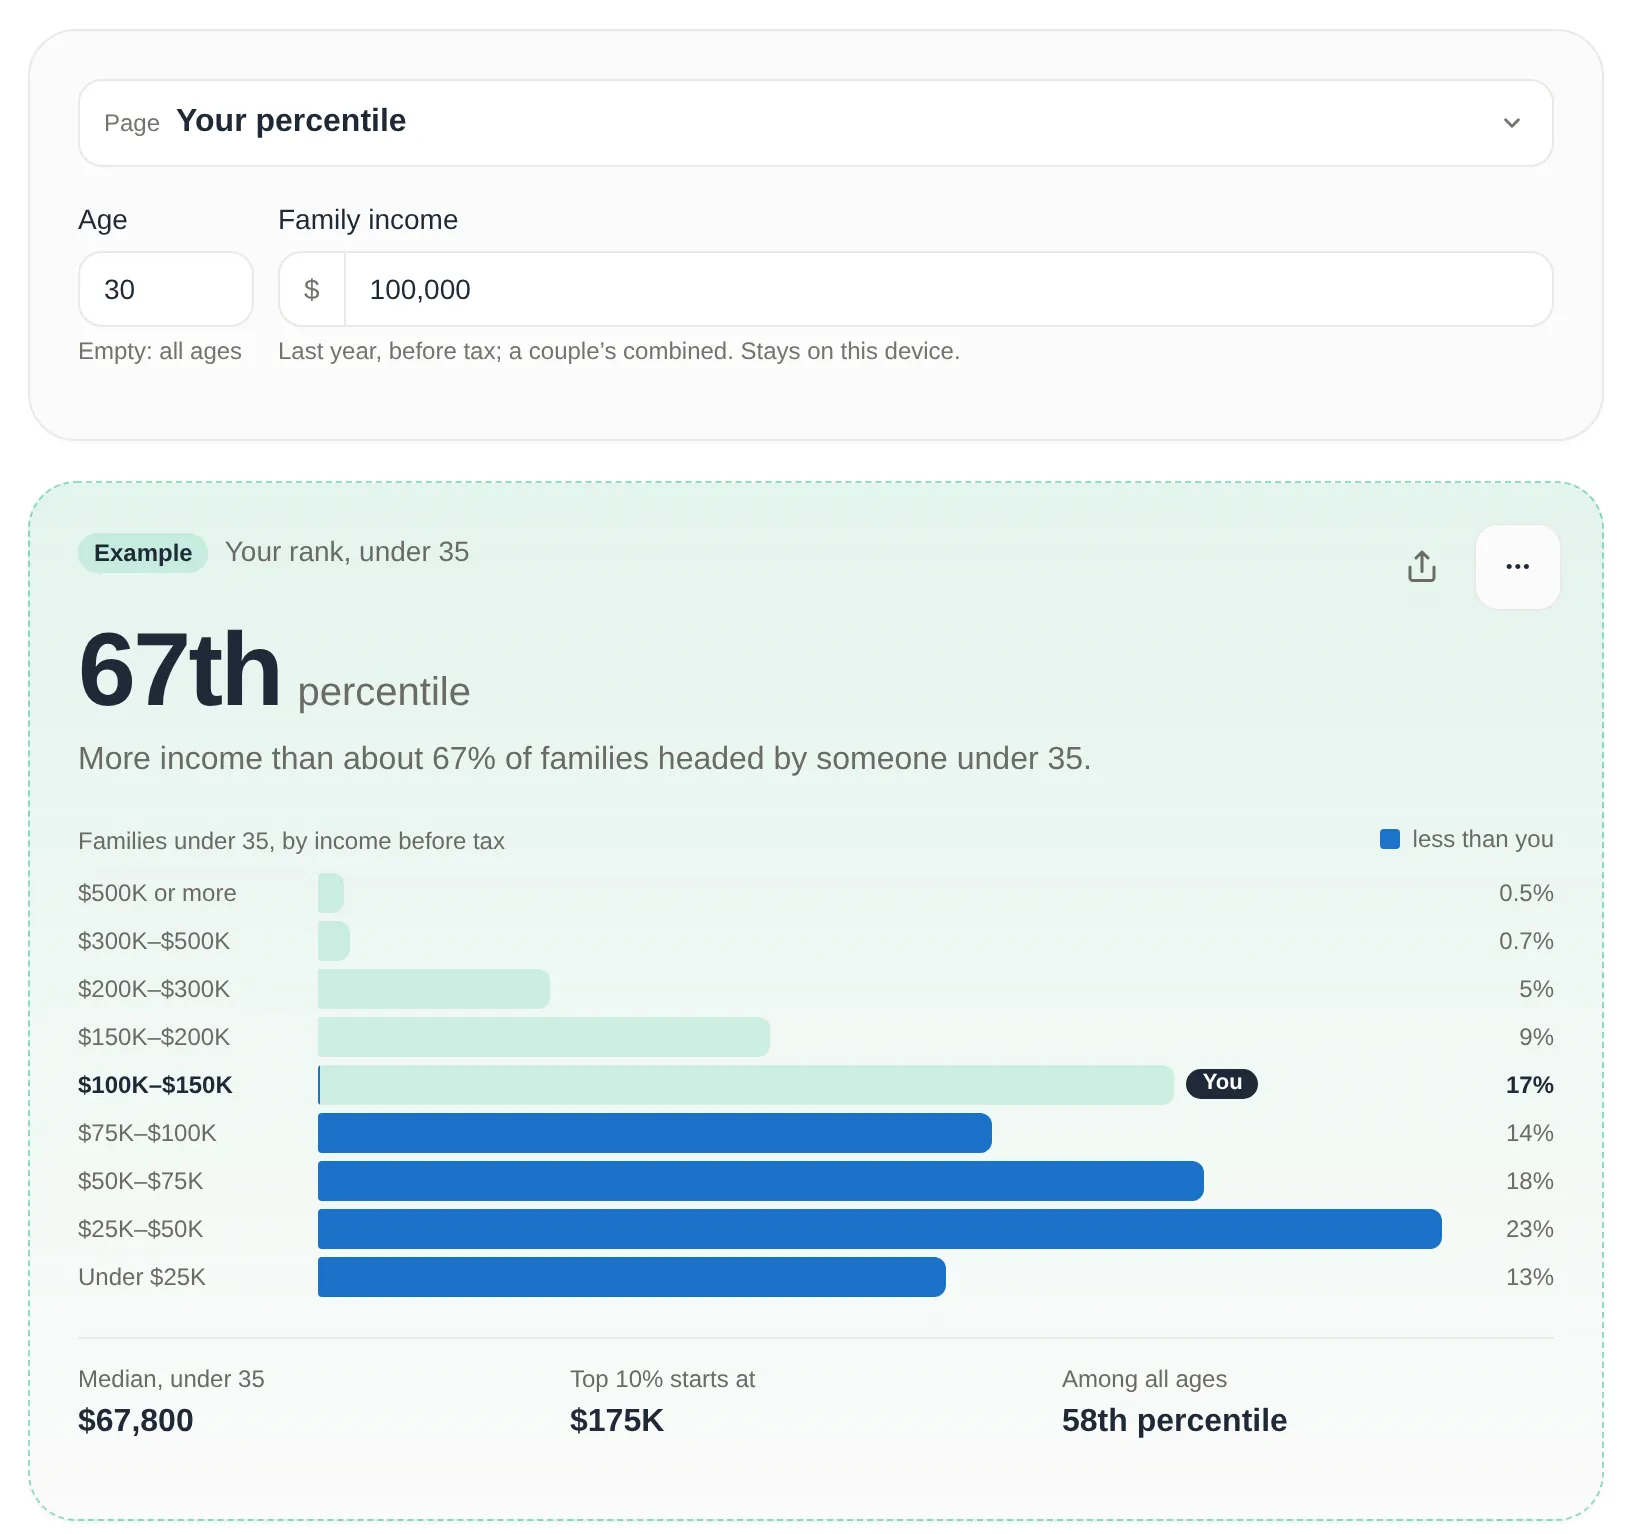
The Income Percentile Calculator does the lookup. Enter your age and last year's household income before tax, and it shows your percentile for your age and among all families, the median for your group, and where the top 10% starts.
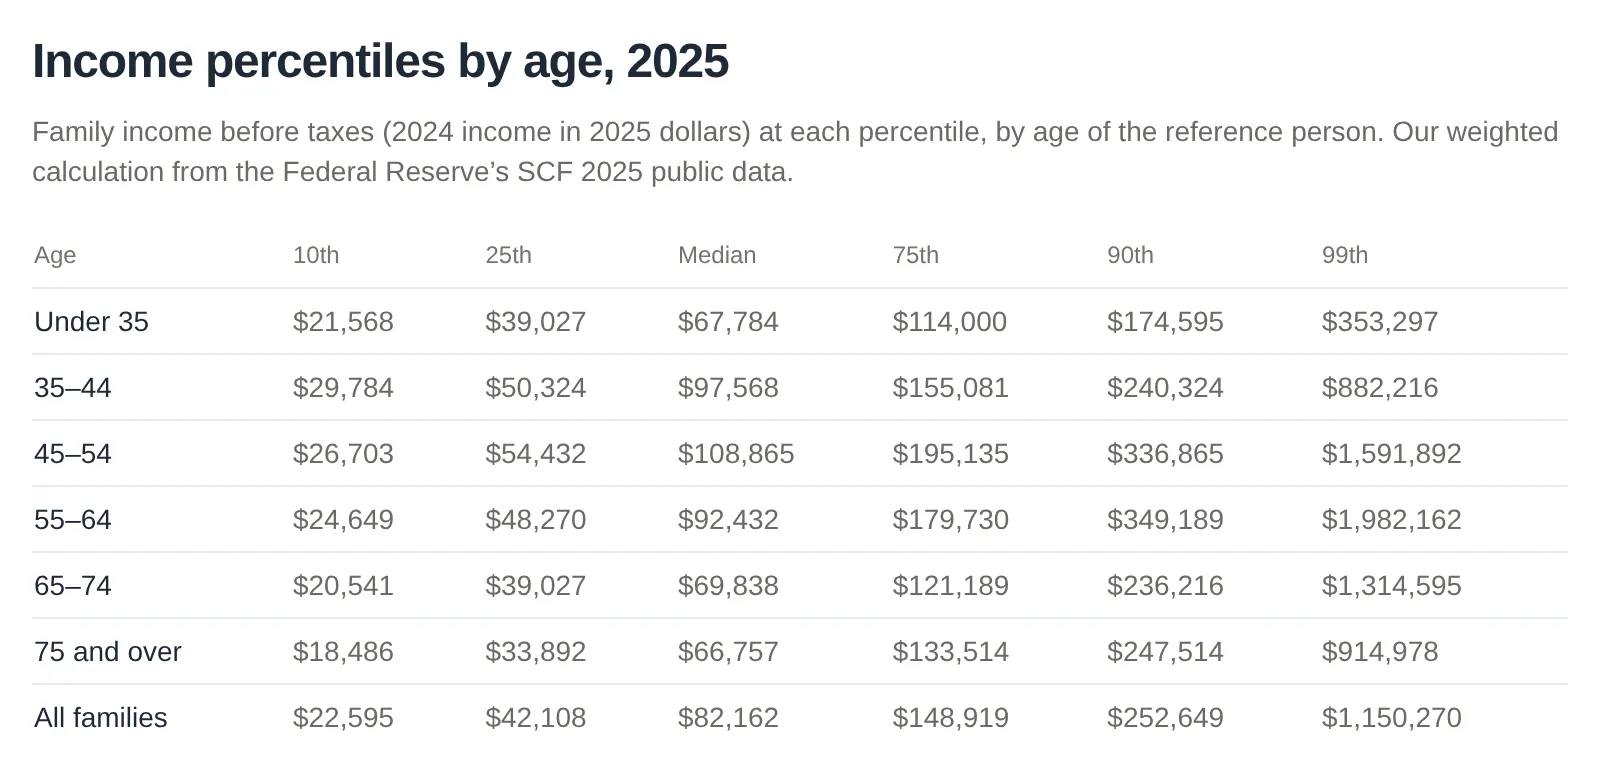
If you want the full tables, income percentile by age has the 10th to 99th percentiles for every age group and the share earning $100,000 or $200,000 or more. Median household income by age has the Fed's medians for every survey back to 1989.
Everything runs in your browser. Your income isn't sent anywhere, and it only goes into the page address if you choose to copy a link with your numbers.
Comparison is a tool, not a verdict
A percentile tells you how many families your age earned less than yours. That's all it does. It doesn't know what rent costs where you live, how many people your income supports, what you owe or what you're building towards. $100,000 goes a long way in some towns and not far at all in others.
Income is also only half the picture. What a household has managed to keep is in net worth by age in 2025, and the savings side has its own retirement savings percentile. If a rank helps you see your situation more clearly, good. If it just makes you feel bad, close the tab. The number in the table was never about you personally.
Sources
- Board of Governors of the Federal Reserve System (October 2026). Changes in U.S. Family Finances from 2022 to 2025: Evidence from the Survey of Consumer Finances. Federal Reserve Bulletin. scf26.pdf. Table 1 (median and mean income by age, 2022 and 2025, and the change), the income section (the fall in mean income, the top 1%, unusual income), footnote 6 (sources of income), appendix A (definition of family, income year, Table A.1 inflation adjustment).
- Board of Governors of the Federal Reserve System. SCF historic tables based on internal data, in 2025 dollars, Table 1. Median income for every survey since 1989.
- Board of Governors of the Federal Reserve System. Survey of Consumer Finances 2025, summary extract public data. Our calculation of the income percentiles overall and by age, the shares earning $100,000 or more, and the percentile of $100,000 and $250,000 by age.
Share this post
Keep reading
Money· Oct 11, 2026· 11 min
How Much Have People Saved for Retirement by Age? (2025 Data)
Median and mean 401(k) and IRA balances by age from the Fed's 2025 survey, the 45% of families with no account at all, and why the median is the fair number.Money· Oct 10, 2026· 10 min
Net Worth by Age in 2025: What the Fed's New Survey Says
Median and average net worth by age from the Fed's 2025 survey: $33,000 under 35, $504,900 at 75+, what the top 10% takes, and why the average misleads.Money· Oct 10, 2026· 10 min
My Inflation Rate: Why Yours Isn't the Official Number
Your personal inflation rate depends on what you buy. How CPI weights work, a commuter vs a renter priced with BLS data, the 2026 gas spike and your raise.