How Much Do You Need to Retire Early? Your FIRE Number
Your FIRE number is 25 times a year's spending at 4%. We tested that rule on every US start year since 1871, including 50-year early retirements.
Money··12 min read
To retire early, the usual answer is 25 times what you spend in a year. Spend $40,000 a year and you need about $1 million invested; spend $60,000 and you need $1.5 million. That's your FIRE number (Financial Independence, Retire Early), and it comes from the 4% rule: take 4% of your starting balance in the first year, raise it with inflation every year after, and history says the money usually lasts.
The catch is the word "usually", and how long "lasts" has to be. The 4% rule was tested on 30-year retirements. If you stop work at 45, yours could run 50 years. So we ran it again on US stock and bond returns going back to 1871, for 30, 40, 50 and 60 years. Over 30 years, 4% lasted in 123 of 126 start years. Over 50 years, it lasted in 96 of 106. If you're planning to stop decades early, 3.5% (about 29 times spending) is the safer number.
Nothing here is financial advice. It's what the arithmetic and the historical record say.
How to work out your FIRE number
You need one number to start: what you spend in a year. Not what you earn, and not what you'd like to spend one day. Your actual spending, including the lumpy things like car repairs, holidays and replacing a laptop every few years. If you're in the US and planning to stop before 65, add health insurance, which your employer may be paying for now.
Then:
FIRE number = yearly spending ÷ withdrawal rate
At 4%, that's the same as multiplying by 25. At 3.5% it's about 28.6, and at 3.25% about 30.8. If you'll pay tax on what you withdraw, the FIRE calculator grosses the target up so you're left with your spending after tax.
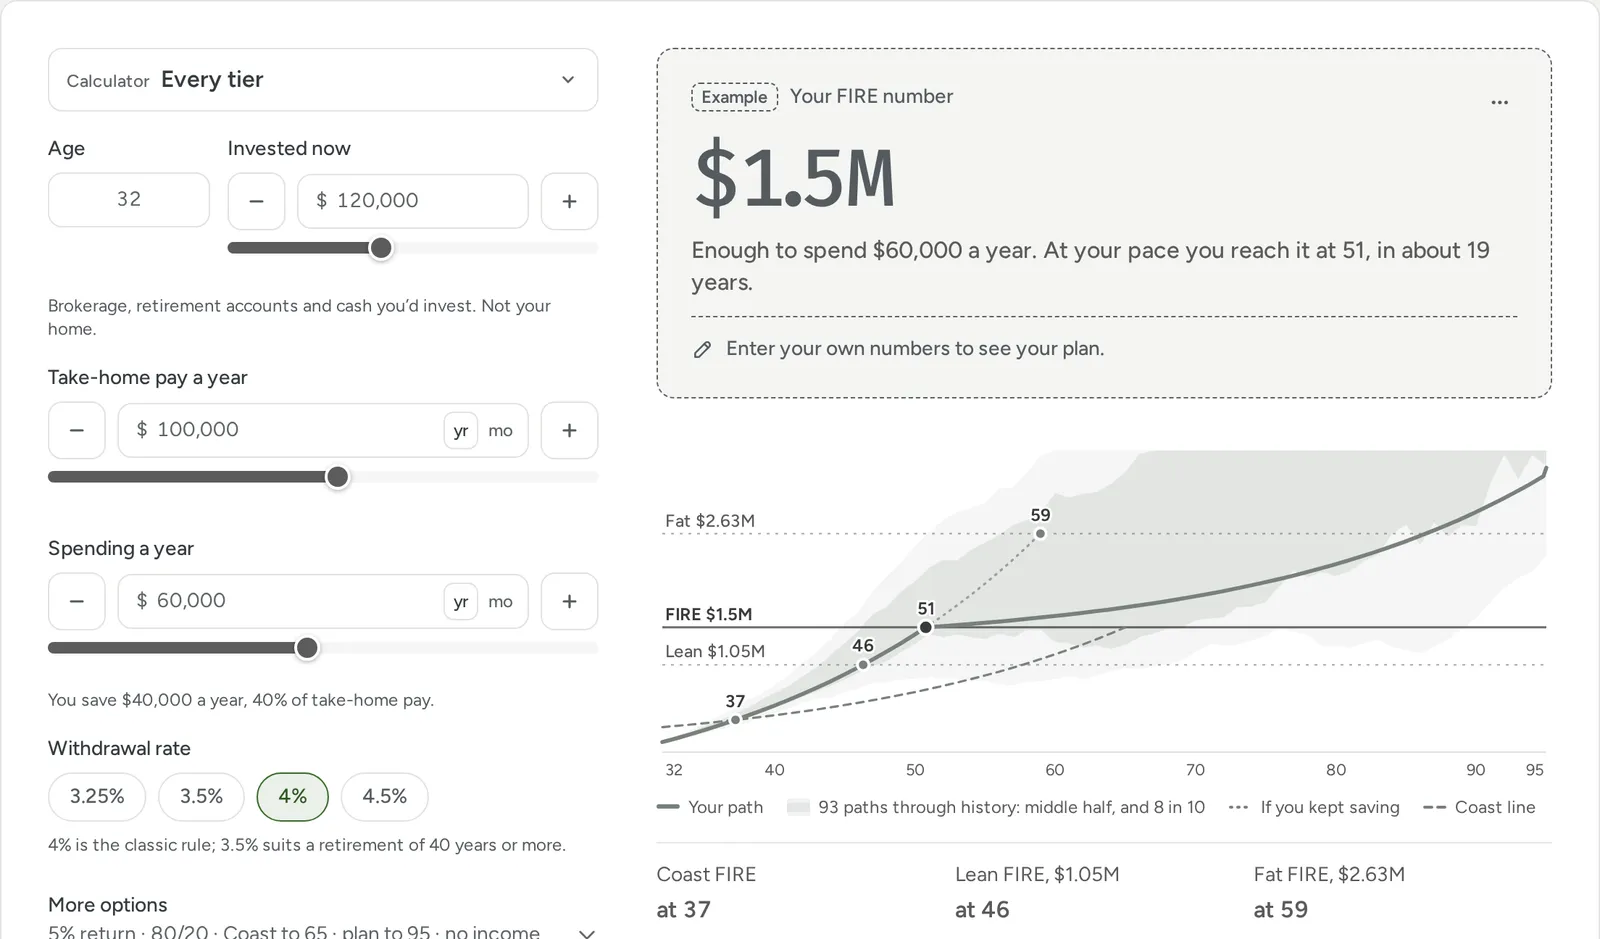
The second question is how long it takes to get there, and that depends almost entirely on how much of your take-home pay you save. Here's the calculator's own example: someone of 32 with $120,000 invested, taking home $100,000 and spending $60,000, so saving $40,000 a year.
- What you spend in a year$60,000
- Divide by the 4% withdrawal rate× 25
- Your FIRE number$1,500,000
- Saving $40,000 a year from $120,000 at 32Age 51
The time comes from a standard savings formula: your balance grows at a fixed return after inflation, and you add your savings at the end of each year until the balance reaches the target. It's the same maths behind Mr. Money Mustache's savings-rate table, which is why saving 40% of take-home pay takes about 22 years from a standing start, whatever your income (fewer if, like this example, you've already saved something). Spending matters twice: every dollar you don't spend is saved, and it also shrinks the target.
The 5% return is an assumption, not a promise. An 80/20 mix of US stocks and bonds earned 6.4% a year after inflation from 1871 to 2025 in Robert Shiller's data, so 5% leaves some room. You can slide it down in the calculator and watch the date move.
Where 4% comes from
In 1994 the financial planner William Bengen tested every 30-year retirement in US history from 1926 on and found that a first-year withdrawal of about 4%, raised with inflation every year, never ran out. The Trinity study followed in 1998 with success rates for different rates and mixes, and "25 times your spending" became the shorthand everyone uses.
Both looked at 30 years, the length of a traditional retirement that starts in your mid-60s. The FIRE crowd took the rule and applied it to retirements that start at 40 or 45. That's the bit worth checking.
We tested 4% on every start year since 1871
The FIRE calculator has a history check built in, and we used the same engine for this table. It uses Shiller's annual US stock, bond and inflation series from 1871 to 2025. The rules match the classic studies: everything is after inflation, the year's spending comes out at the start of each year, the rest is invested 80% in stocks and 20% in bonds and rebalanced yearly, and a start year "lasted" if there was money left at the end of every year.
| Retirement length | 4% lasted | 3.5% lasted | Highest rate that always lasted |
|---|---|---|---|
| 30 years | 123 of 126 (97.6%) | 126 of 126 | 3.79% |
| 40 years | 109 of 116 (94.0%) | 116 of 116 | 3.56% |
| 50 years | 96 of 106 (90.6%) | 105 of 106 | 3.40% |
| 60 years | 87 of 96 (90.6%) | 94 of 96 | 3.33% |
So 4% isn't the edge of a cliff for an early retiree, but it's not the near-certainty it is over 30 years either. Roughly one start year in ten failed over 50 years. The chart below shows how quickly the odds fall as the rate goes up, for a 50-year retirement.
Show the numbers
| Value | |
|---|---|
| 3% | 100.0% |
| 3.25% | 100.0% |
| 3.5% | 99.1% |
| 3.75% | 95.3% |
| 4% | 90.6% |
| 4.25% | 82.1% |
| 4.5% | 71.7% |
| 5% | 62.3% |
A few cautions about what this table can and can't tell you:
- Start years overlap. A 50-year retirement starting in 1900 shares 49 years with one starting in 1901. The 106 start years hold only about three truly independent 50-year stretches of history.
- The US had one of the best markets of the last century. Across 38 developed countries, a 4% rate with 60% in stocks failed 17.4% of the time (Anarkulova, Cederburg, O'Doherty and Sias, 2025). Looking forward instead of back, Morningstar's 2025 report puts a safe starting rate at 3.9% for 30 years and 3.5% for 35.
- Real people adjust. The test assumes you spend exactly the same real amount every year, whatever happens. Most people cut back in a bad year, and many earn something after they "retire".
Why 1966 is the year everyone worries about
The failures cluster. Most of the 4% failures in the table started between 1962 and 1973, and the rest in a handful of years: 1902, 1906 and 1907, 1929 and 1937. The worst was 1966, and it's worth looking at because it didn't fail from one crash.
Show the numbers
| Years retired | Retired in 1966 | Retired in 1929 | Middle of all 126 start years |
|---|---|---|---|
| 0 | $1.5M | $1.5M | $1.5M |
| 1 | $1.34M | $1.35M | $1.55M |
| 2 | $1.38M | $1.14M | $1.58M |
| 3 | $1.38M | $779K | $1.63M |
| 4 | $1.14M | $769K | $1.71M |
| 5 | $1.13M | $1.01M | $1.75M |
| 6 | $1.17M | $877K | $1.77M |
| 7 | $1.23M | $1.17M | $1.79M |
| 8 | $939K | $1.37M | $1.89M |
| 9 | $660K | $977K | $2.02M |
| 10 | $745K | $1.07M | $2.07M |
| 11 | $725K | $1.05M | $2.12M |
| 12 | $581K | $912K | $2.12M |
| 13 | $539K | $706K | $2.22M |
| 14 | $478K | $707K | $2.32M |
| 15 | $452K | $750K | $2.33M |
| 16 | $343K | $786K | $2.31M |
| 17 | $362K | $939K | $2.35M |
| 18 | $339K | $675K | $2.5M |
| 19 | $295K | $570K | $2.56M |
| 20 | $286K | $546K | $2.68M |
| 21 | $290K | $568K | $2.77M |
| 22 | $215K | $601K | $2.86M |
| 23 | $172K | $611K | $2.92M |
| 24 | $129K | $615K | $2.97M |
| 25 | $66K | $569K | $3.25M |
| 26 | $8K | $706K | $3.35M |
| 27 | $0 | $793K | $3.37M |
| 28 | $0 | $748K | $3.38M |
| 29 | $0 | $642K | $3.31M |
| 30 | $0 | $755K | $3.37M |
Someone who retired at the start of 1966 saw the 80/20 mix lose 1.5% a year after inflation over the first decade, as inflation climbed from 3.5% to 11.8% in 1974. Over the full 30 years the mix actually averaged 4.5% a year after inflation, comfortably more than the 4% being withdrawn. It still ran dry, because the bad years came first, while the withdrawals were biggest relative to the balance. This is sequence-of-returns risk, and it's the real reason a withdrawal rate needs a margin.
Compare 1929. The crash cut the portfolio almost in half in three years, but deflation and a strong recovery let it hold on, and it finished 30 years with about $755,000. Most start years did far better than either: the middle path ended with more than twice what it started with.
Lean, Fat, Coast and Barista FIRE
Once you have your FIRE number, the variations are just different spending figures, or different questions:
- Lean FIRE is the same sum on a bare-bones budget. A common line is spending under about $40,000 a year, so about $1 million at 4%. It's the fastest way out and leaves the least room for surprises. See the Lean FIRE calculator.
- Fat FIRE is a generous budget, often put at $100,000 a year or more, so $2.5 million and up. On a big budget a quarter of a point on the withdrawal rate moves the target by hundreds of thousands. Fat FIRE calculator.
- Coast FIRE asks when what you've already invested would grow to your FIRE number by 65 with no more saving. We go through it in What Is Coast FIRE?, and the Coast FIRE calculator works it out.
- Barista FIRE means leaving full-time work while part-time income covers part of your spending. With a $20,000 part-time income, the example above needs $1 million instead of $1.5 million and gets there at 46 instead of 51. Barista FIRE calculator.
The FIRE calculator shows all of these at once from the same inputs, with the age you reach each one. It also runs the history check on your own plan: for the example, retiring at 51 means 44 years of withdrawals to 95, and 4% lasted that long in 104 of 112 start years.
So how much do you need?
For most early-retirement plans, a sensible range is 25 to 30 times your yearly spending:
- 25 times (4%) if you're retiring in your 50s, or you'd happily cut spending or pick up some work in a bad decade.
- About 28.5 times (3.5%) if you're stopping in your 30s or 40s and want the plan to hold through the worst US stretches on record without changing anything.
- Around 30 times (3.25% to 3.4%) if you want margin against a future that's worse than the US past, or your spending has little room to bend.
Whatever you pick, the biggest lever isn't the rate. It's your spending, which sets the target and your savings at the same time. Put your own numbers into the FIRE calculator: it shows your number, the age you reach it, what moves that date most, and how your exact plan would have done through every stretch of US history since 1871. Everything runs in your browser, and nothing you type is sent anywhere.
Sources
- Robert J. Shiller. Online Data for Irrational Exuberance: monthly US stock prices, dividends, 10-year Treasury yields and CPI since 1871 (data to January 2026), turned into annual real returns for the FIRE calculator. Every success rate, the 1966 and 1929 paths and the 6.4% average are our calculation from it.
- Aswath Damodaran, NYU Stern. Historical Returns on Stocks, Bonds and Bills, 1928 onwards. An independent series the calculator's tests check the Shiller results against (4% for 30 years lasted in 66 of 69 start years, 95.7%, on Damodaran's data from 1928).
- William P. Bengen (1994), "Determining Withdrawal Rates Using Historical Data", Journal of Financial Planning; Cooley, Hubbard and Walz (1998), the Trinity study. Summary with citations: Wikipedia.
- Anarkulova, Cederburg, O'Doherty and Sias (2025). The Safe Withdrawal Rate: Evidence from a Broad Sample of Developed Markets. Journal of Pension Economics and Finance.
- Morningstar (2025). The State of Retirement Income: safe withdrawal rates.
- Mr. Money Mustache (2012). The Shockingly Simple Math Behind Early Retirement.
Share this post
Keep reading
Money· Nov 14, 2026· 8 min
What Is Coast FIRE? How Much You Need by Age
Coast FIRE is when your investments can grow to your FIRE number by 65 with no more saving. The formula, a table by age, and how often it worked since 1871.Money· Oct 24, 2026· 18 min· Updated Nov 2026
Lease vs Buy a Car: Which Really Costs Less Over 6 Years?
On a $40,000 car, two 3-year leases cost $50,524 over 6 years; buying and keeping it cost $37,124 after resale value. How each payment works, worked out.Money· Oct 11, 2026· 12 min· Updated Nov 2026
How Much Have People Saved for Retirement by Age? (2025 Data)
Median and mean 401(k) and IRA balances by age from the Fed's 2025 survey, the 45% of families with no account at all, and why the median is the fair number.