How Much Have People Saved for Retirement by Age? (2025 Data)
Median and mean 401(k) and IRA balances by age from the Fed's 2025 survey, the 45% of families with no account at all, and why the median is the fair number.
Money··11 min read
Among US families that have a retirement account, the typical balance in 2025 was $106,000, according to the Federal Reserve's new Survey of Consumer Finances. By age, that median runs from $21,000 for families under 35 to $257,000 for families 65 and over. But 45.1% of families had no retirement account at all, and once you count them, the middle family in several age groups has $0 saved in these accounts (Federal Reserve Bulletin, October 2026, Table 3).
Both of those things are true at once, and most of the confusion about "average retirement savings" comes from mixing them up. Below: the numbers by age, how many families have nothing, what 401(k)s and IRAs look like on their own, and what the data can and can't tell you about being "on track". It's a description of what families have, not financial advice.
Retirement savings by age in 2025
The Fed reports retirement balances the way it reports most assets: first the share of families that have one, then the median and mean balance among those that do. Retirement accounts here mean IRAs (traditional and Roth), Keoghs, and account-type workplace plans such as 401(k)s, 403(b)s and the federal Thrift Savings Plan, including old ones left with a past employer.
| Age | Have an account | Median, if any | Mean, if any |
|---|---|---|---|
| Under 35 | 48.8% | $21,000 | $48,400 |
| 35 to 44 | 59.6% | $61,200 | $182,400 |
| 45 to 54 | 63.0% | $133,000 | $415,800 |
| 55 to 64 | 63.1% | $239,000 | $670,200 |
| 65 to 74 | 49.0% | $257,000 | $767,600 |
| 75 and over | 44.6% | $257,000 | $798,700 |
| All families | 54.9% | $106,000 | $451,100 |
These come from the Fed's historic tables in 2025 dollars (Table 6). The Bulletin prints the all-family row and the means for the four younger groups, and they match. Balances are what families reported at their interview. Most interviews took place between April and December 2025, with about one in seven finished early in 2026 (Bulletin, appendix B).
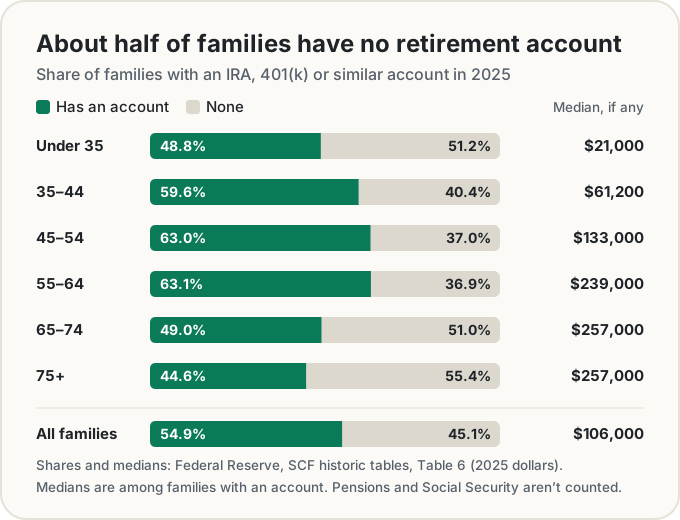
The shape is the one you'd guess. Balances build through working life and peak around retirement. What surprises people is the left-hand column: at no age do even two thirds of families have one of these accounts.
Almost half of families have none
In 2025, 45.1% of US families had no IRA, 401(k) or similar account. That rises to 51.2% of families under 35, 51.0% at 65 to 74 and 55.4% at 75 and over.
The reasons differ by age. Many young families work for employers that don't offer a plan, or haven't started one yet. The Fed's numbers on that are actually encouraging: among the youngest families, participation in IRAs and 401(k)-type plans rose from 42% in 2016 to near 50% in 2025 (Bulletin, Box 2).
For older families, two things pull the share down. Some have spent or withdrawn their savings. And these accounts are younger than today's retirees: in 1989, only 6.3% of families 75 and over had one, against 44.6% now.
There's also a big thing the table leaves out on purpose. Traditional pensions that pay a set monthly income (defined-benefit plans) aren't accounts with a balance, so they aren't counted. Neither is Social Security. The Fed says defined-benefit plans are held by around one in four families, and counting them along with IRAs and 401(k)s, 65.1% of families headed by someone 64 or younger took part in some retirement plan (Box 2). A retired teacher with a pension and no IRA shows up here as $0. That family may be in better shape than the numbers suggest.
Why the median is the fair number
The mean adds up every balance and divides by the number of families with an account. A few very large accounts pull it far up. Among families aged 55 to 64 with an account, the mean is $670,200 and the median is $239,000. Almost three times as much. If you read that "the average 55-year-old has $670,000 saved", that's a true mean that describes very few people. For "what does a typical saver my age have?", the median is the honest answer.
There's a second trap, and it's sneakier. "Median retirement savings" can mean two different things:
- The median among families with an account. That's the Fed's published figure, $21,000 under 35.
- The median of all families, counting those with none as $0. For families under 35 that's $0, because more than half of them have no account.
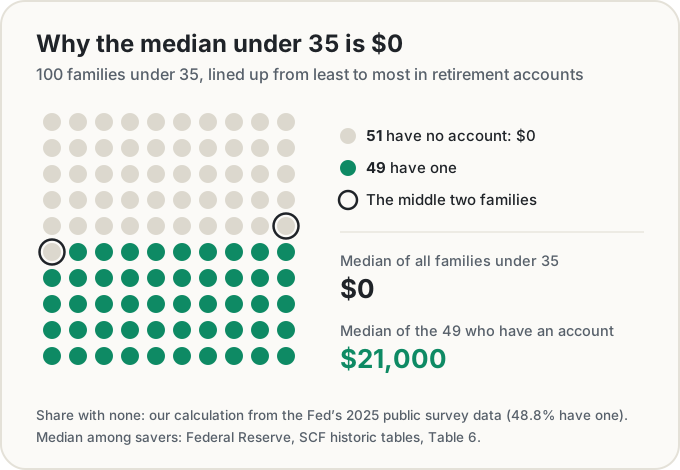
Counting everyone, the median for all families was $5,000 in 2025. It was $7,000 at 35 to 44, $37,000 at 45 to 54 and $45,000 at 55 to 64, and $0 under 35 and at 65 and over. Those figures are our calculation from the Fed's public data file, the same table our calculator uses. Neither median is wrong. They answer different questions, so check which one a headline is quoting before you compare yourself with it.
401(k)s and IRAs on their own
The Fed publishes the total of all retirement accounts but not a split by type. We worked one out from the public data, and the two parts add back up to the Fed's total for every family in the file.
| Age | Have a 401(k)-type plan | Median, if any | Have an IRA | Median, if any |
|---|---|---|---|---|
| Under 35 | 42.8% | $14,000 | 19.2% | $19,810 |
| 35 to 44 | 52.5% | $60,000 | 24.9% | $49,500 |
| 45 to 54 | 54.6% | $110,000 | 31.3% | $77,000 |
| 55 to 64 | 50.0% | $133,000 | 36.5% | $195,000 |
| 65 to 74 | 23.4% | $130,000 | 36.4% | $250,000 |
| 75 and over | 11.7% | $66,000 | 38.3% | $257,000 |
| All families | 40.3% | $66,000 | 30.5% | $100,000 |
"401(k)-type" covers 401(k)s, 403(b)s, thrift plans and similar accounts, at a current job or left with an old one; the survey doesn't separate them. Notice the crossover after 65. Workplace plans become rare while IRAs become more common, which fits people rolling an old 401(k) into an IRA when they retire or change jobs.
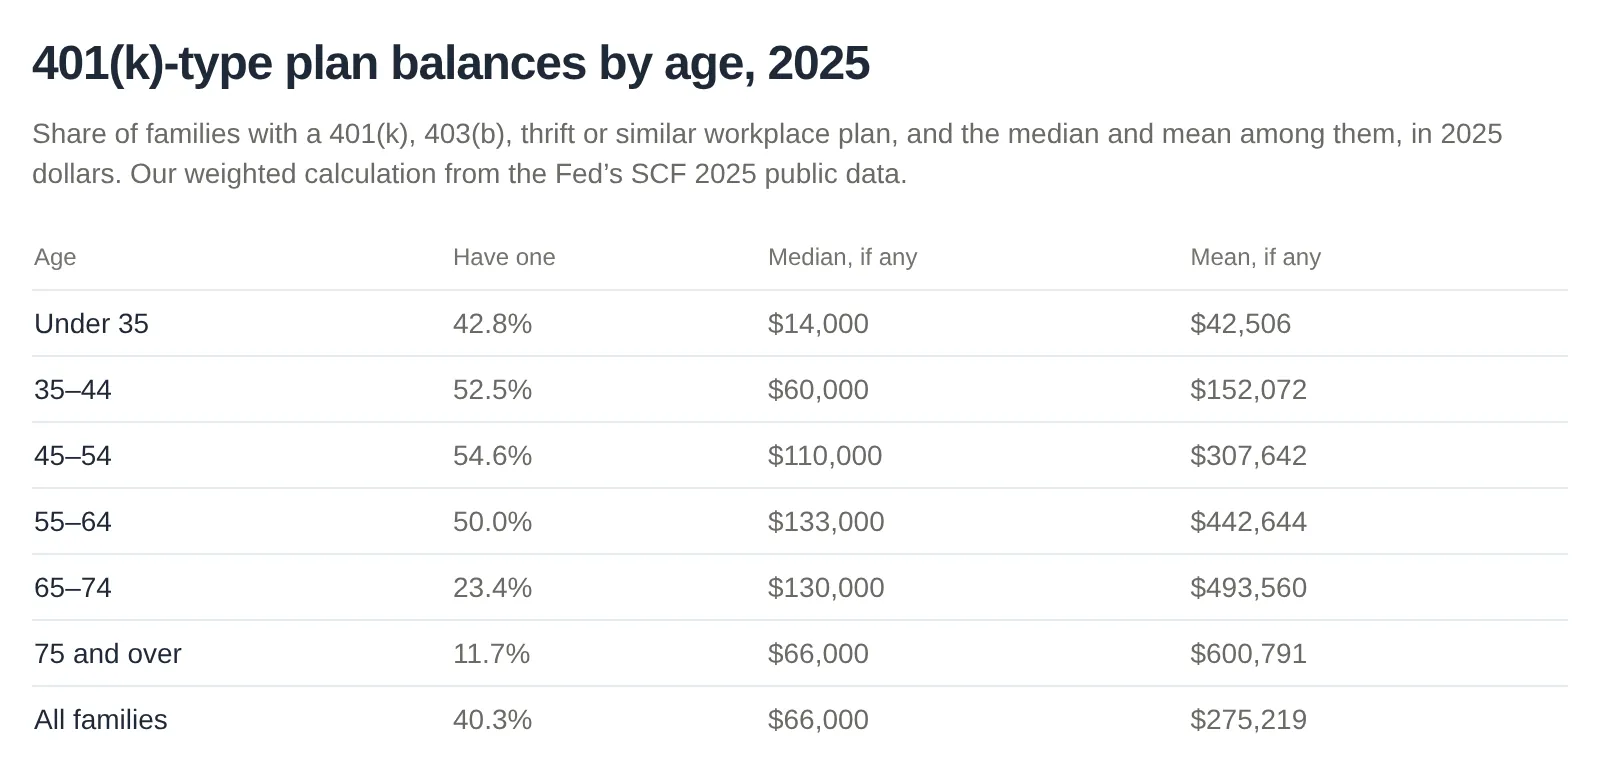
If you've seen much higher "average 401(k) by age" figures from a plan provider, that's normal. Those usually describe one person's account at one company and leave out everyone without an account. The survey adds up a whole family's plans, which is the fairer comparison for a household. The full tables, with the means, are on our 401(k) balance by age page.
What changed since 2022
Retirement accounts had a good three years. Among families that have one, the median rose 11% after inflation, from $95,200 to $106,000, and the mean rose 23% to $451,100 (Table 3). The share of families with an account barely moved, from 54.3% to 54.9%.
The median rose in every age group (Box 2 says so for families under 65, and the historic tables show it for the older two). The biggest jump was for families 75 and over, from $143,400 to $257,000 in today's dollars. The one soft spot was the mean for families under 35, which slipped from $53,800 to $48,400, though their median edged up to $21,000. The Fed also credits rising retirement accounts with most of the jump in net worth for the oldest families, which we covered in net worth by age in 2025.
What "on track" can and can't mean
This is where a survey runs out of road. A percentile tells you how your balance compares with other families your age. It can't tell you whether it's enough, because that depends on things the survey never sees:
- When you plan to stop working, and how many years the money has to cover.
- What you'll spend. Someone with a paid-off house needs a very different number from someone renting in a big city.
- What else will pay you. Social Security is the big one for most people, and your own estimate is on my Social Security at the Social Security Administration. A pension changes the picture completely.
- What you have outside these accounts: home equity, a brokerage account, a business. The net worth calculator takes all of that in.
You'll also see rules of thumb that turn your salary into a target for each age. They can be a handy prompt, but each one bakes in assumptions about your income, your retirement age and your spending, and it's worth knowing what they are before you take one as a verdict on yourself.
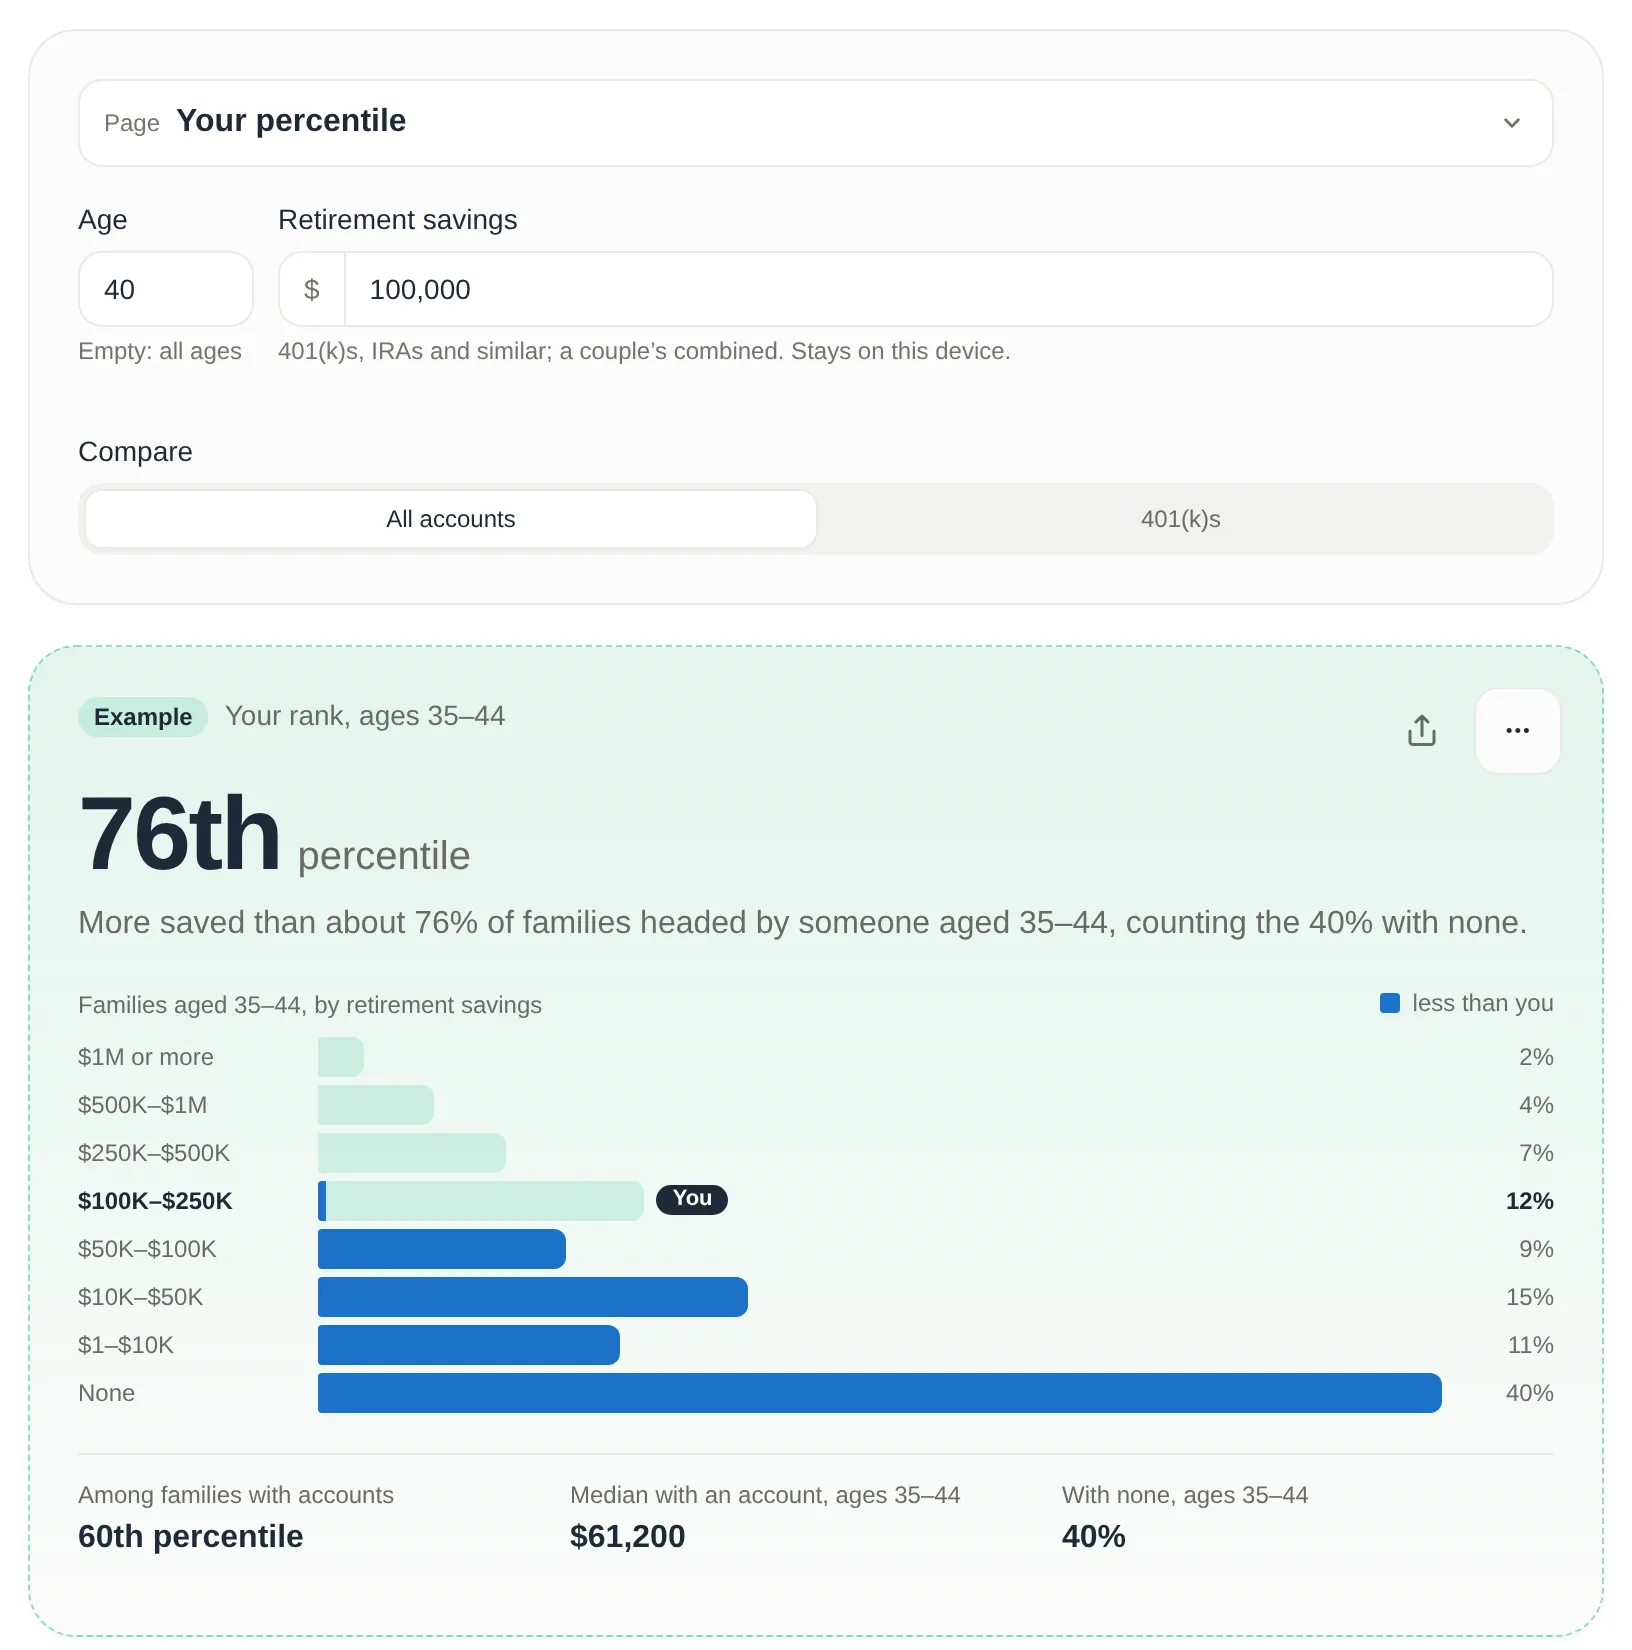
What a comparison is good for: a sense of proportion. Here's an example. A family aged 40 with $100,000 across its 401(k)s and IRAs is at about the 76th percentile of all families aged 35 to 44, because 40% of them have nothing in these accounts. Among only the families that have an account, the same $100,000 is at the 60th percentile. One rank says "ahead of most people your age", the other says "a bit above the typical saver". Both are true.
If you want to see what steady contributions could grow to, the compound interest calculator does that. For decisions about your own money, a qualified adviser who can see your whole situation is worth more than any table.
Two caveats before you compare
A family is not a person. The survey's "family" is the single person or couple who run a household's money, married or not, plus anyone financially tied to them. If you're in a couple, add both partners' accounts together before comparing. And the "age" is one partner's: the Fed groups a couple by the man's age in a mixed-sex couple and the older partner's in a same-sex one, purely as a way to organise the data (Bulletin, appendix A).
It's a survey, and a snapshot. The Fed interviewed 4,367 families in 2025 and weighted them to stand for the whole country. Every figure has some sampling error, and the very top percentiles within one age group rest on only a handful of families. Markets have also moved since the interviews, so today's balances will differ.
Find your own percentile
The Retirement Savings Percentile Calculator gives you both ranks for your age, for all your accounts or for 401(k)s alone. If you just want the tables, there's average retirement savings by age, with the medians back to 1989, and 401(k) balance by age. Your numbers stay in your browser; they only go into the page address if you choose to copy a link with them.
Comparison is a tool, not a verdict. If your number is lower than you'd like, you're in a lot of company, and the direction it's moving matters more than where it sits today.
Sources
- Board of Governors of the Federal Reserve System (October 2026). Changes in U.S. Family Finances from 2022 to 2025: Evidence from the Survey of Consumer Finances. Federal Reserve Bulletin. scf26.pdf. Table 3 (retirement accounts for all families: share holding, median and mean, change since 2022), Box 2 (plan participation including pensions, participation of the youngest families, defined-benefit plans, Table A means by age, medians rising for all ages), appendix A (definitions of family, reference person and retirement accounts), appendix B (interview dates, families interviewed).
- Board of Governors of the Federal Reserve System. SCF historic tables based on internal data, in 2025 dollars, Table 6. The share with an account and the median and mean by age, 1989 to 2025.
- Board of Governors of the Federal Reserve System. Survey of Consumer Finances 2025, summary extract public data. Our calculation of the medians counting families with none, the 401(k)-type and IRA split, and the percentile ranks in the example.
- Social Security Administration. my Social Security. Personal estimates of future benefits.
Share this post
Keep reading
Money· Oct 11, 2026· 10 min
What Household Income Is Top 10%, 5% or 1%? (2025 Data)
The family income it takes to reach the top 10%, 5% and 1% in the Fed's 2025 survey, overall and by age, the median by age, and what counts as income.Money· Oct 10, 2026· 10 min
Net Worth by Age in 2025: What the Fed's New Survey Says
Median and average net worth by age from the Fed's 2025 survey: $33,000 under 35, $504,900 at 75+, what the top 10% takes, and why the average misleads.Money· Oct 10, 2026· 10 min
My Inflation Rate: Why Yours Isn't the Official Number
Your personal inflation rate depends on what you buy. How CPI weights work, a commuter vs a renter priced with BLS data, the 2026 gas spike and your raise.