Net Worth by Age in 2025: What the Fed's New Survey Says
Median and average net worth by age from the Fed's 2025 survey: $33,000 under 35, $504,900 at 75+, what the top 10% takes, and why the average misleads.
Money··10 min read
The typical American family had a net worth of $215,900 in 2025, according to the Federal Reserve's new Survey of Consumer Finances. By age, the median runs from $33,000 for families headed by someone under 35 to $504,900 for families 75 and over (Federal Reserve Bulletin, October 2026, Table 2). The average is far higher, $1,241,500 for all families, but that number describes very few of them.
The survey runs every three years, so this is the first fresh look since 2022. Below: the numbers by age, what changed, what it takes to reach the top 10%, and how to work out where you stand. Nothing here is financial advice. It's what the data says.
Median net worth by age in 2025
Net worth is everything a family owns minus everything it owes, at the moment of the interview. Here are the Fed's own medians. All of them are in 2025 dollars, so the 2022 column is already adjusted for inflation. (The averages are further down, with a warning.)
| Age | 2022 | 2025 | Change |
|---|---|---|---|
| Under 35 | $42,700 | $33,000 | −23% |
| 35 to 44 | $148,400 | $155,600 | +5% |
| 45 to 54 | $270,600 | $253,700 | −6% |
| 55 to 64 | $398,900 | $411,900 | +3% |
| 65 to 74 | $448,600 | $431,300 | −4% |
| 75 and over | $367,300 | $504,900 | +37% |
| All families | $211,100 | $215,900 | +2% |
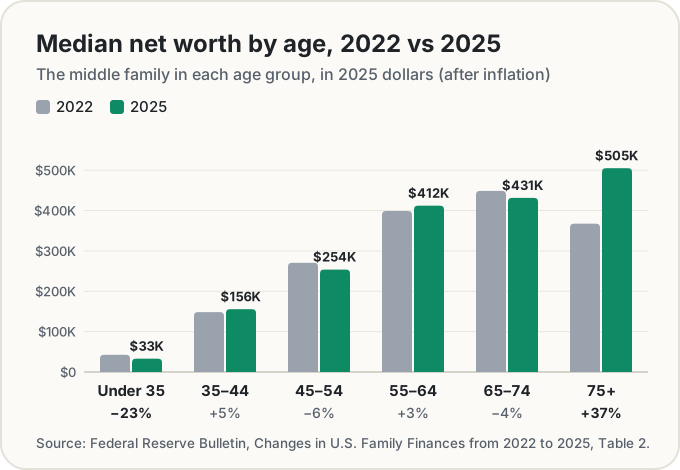
The overall shape is the one you'd expect. Net worth climbs through working life as people pay down mortgages and build up retirement savings, then levels off. The Bulletin describes exactly that pattern: wealth rises and then plateaus or falls over the life cycle as people save for retirement and then spend it.
Two age groups broke from the script this time, though.
Under 35 lost the most, 75 and over gained the most
The median for families under 35 fell 23%, from $42,700 to $33,000. Their mean fell even harder, 33%. The Fed puts this down mainly to "the unwinding of business equity gains between 2019 and 2022". Young families had a big run-up in those years, and some of it went away.
It helps to look one survey further back. In 2019 the under-35 median was $17,600 in today's dollars (Fed historic tables). So 2022 was an unusual peak, and $33,000 is still almost twice the 2019 figure. It's a step back, not a collapse.
At the other end, families 75 and over saw their median jump 37% to $504,900. For the first time in several surveys, the oldest group is the wealthiest, ahead of families aged 65 to 74. The Fed says the rise was mainly driven by retirement accounts going up in value.
One more number for younger readers: 16.8% of families under 35 owe more than they own, against 8.1% of all families. That's our calculation from the Fed's public data file. If your net worth is negative in your twenties, you have a lot of company.
Why the average misleads
The mean adds up every family's net worth and divides by the number of families. That sounds fair until you remember how lopsided wealth is. The Fed's top 10% of families by net worth had a mean of $8,975,200 in 2025 (Table 2). A handful of families like that pull the average a long way up without adding many people to the count.
So for all families, the mean of $1,241,500 is almost six times the median of $215,900. And in every age group, about four in five families have less than the average:
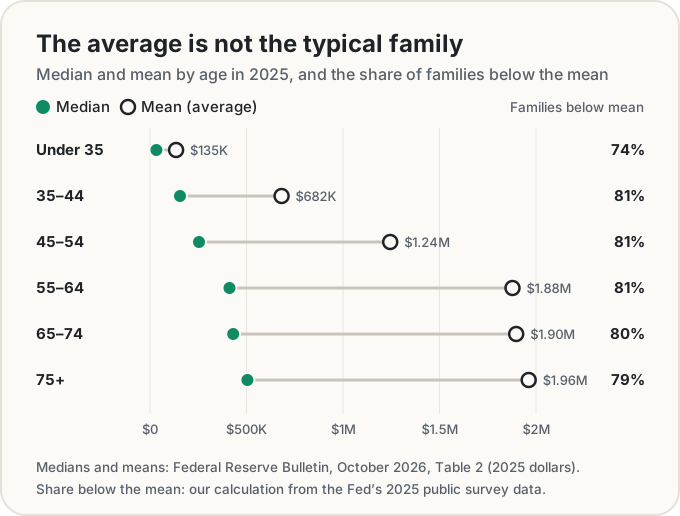
That's the trap in a line like "the average family in its late fifties has $1.9 million". It's a true mean (the 55 to 64 mean is $1,878,000), and about 81% of families that age have less. If you see an "average net worth by age" figure, check whether it's a mean. If it is, compare yourself with the median instead.
The median has a blind spot too. It tells you where the middle is, not how spread out everyone else is. For that you need percentiles.
What it takes to reach the top 10%
The Fed publishes a few percentiles for all families together (Table A.2). In 2025:
- 25th percentile: $27,900. A quarter of families had less.
- Median (50th): $215,900.
- 75th percentile: $812,800.
- 90th percentile: $2,539,200. That's the line for the top 10%.
The Bulletin doesn't give those cut-offs by age, so we worked them out from its public data file, weighting every family the way the survey does (K is thousands, M is millions):
| Age | 25th | Median | 75th | Top 10% from |
|---|---|---|---|---|
| Under 35 | $3K | $33K | $145K | $351K |
| 35 to 44 | $18K | $156K | $468K | $1.23M |
| 45 to 54 | $55K | $255K | $942K | $2.56M |
| 55 to 64 | $72K | $411K | $1.42M | $3.46M |
| 65 to 74 | $118K | $432K | $1.31M | $3.66M |
| 75 and over | $144K | $505K | $1.42M | $4.19M |
The public file is altered slightly to protect the people who answered, so its medians are within 1% of the Fed's published ones but not identical. The full table, with the 10th and 99th percentiles too, is on our net worth by age page.
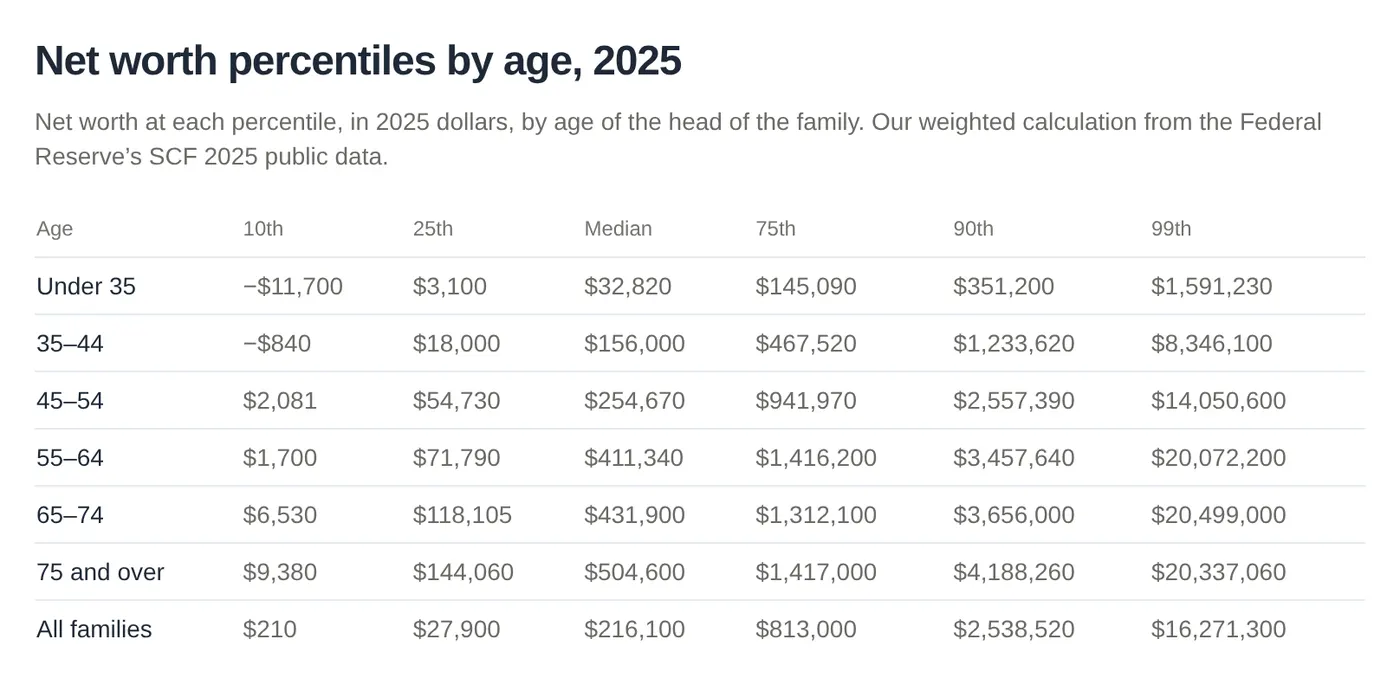
Look at the spread inside a single row. Among families aged 45 to 54, the 25th percentile is about $55,000 and the 90th is about $2.6 million. That gap is far bigger than the difference between one age group's median and the next. Any single "target for your age" hides most of that.
And millionaires aren't as rare as they feel: 21.5% of all families had a net worth of $1 million or more in 2025, rising to about a third of families 55 and over (our calculation from the public data).
So what's a "good" net worth at 30, or at 40?
There isn't one number, because "good" depends on what you're comparing with. A percentile is the fairest version of the question: how many families your age have less than you?
A few examples from the same data:
- $50,000 at 30 puts you at about the 55th percentile for families under 35. More than half of them have less.
- $100,000 at 40 is about the 41st percentile for 35 to 44.
- $250,000 at 40 is about the 62nd.
Even a percentile leaves a lot out. Where you live, what you earn, whether you have student loans and whether you own a home all move the number. That last one is huge: in 2025 the median net worth of homeowners was $458,900, against $10,600 for renters (Table 2). A renter in an expensive city and an owner in a cheap one aren't playing the same game, even at the same age.
So a "good" net worth is mostly a relative idea. The more useful question is usually whether yours is moving in the direction you want, year by year.
How to calculate your net worth
It takes about ten minutes with your account balances open.
- Add up what you own. Cash and savings, checking, retirement accounts such as a 401(k) or IRA, other investments, what your home would sell for, other property, your car, and any business you own.
- Add up what you owe. Mortgage, car loans, student loans, credit card balances and anything else.
- Subtract the second from the first. That's your net worth. It can be negative.
If you want to compare with the Fed's numbers, count things the way the survey does. It includes vehicles. It leaves out Social Security and traditional defined-benefit pensions, because a future stream of payments doesn't have a clear value today (Bulletin, note 36).
Then put your age and number into the Net Worth Percentile Calculator. It shows your percentile for your age and among all families, next to the Fed's median for your group. There's an "Add it up" helper if you'd rather fill in the pieces than do the sum yourself.
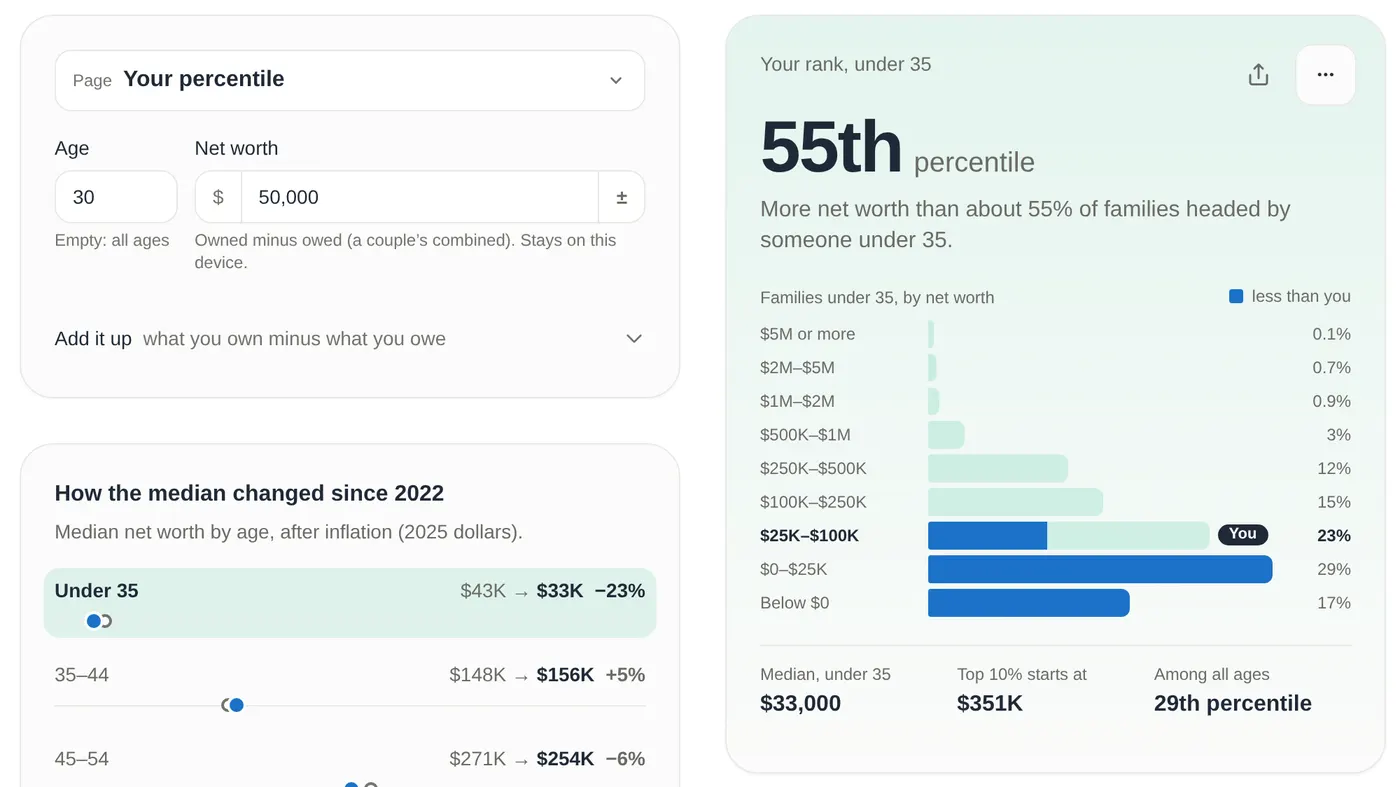
It all runs in your browser. Your net worth isn't sent anywhere, and it only goes into the page address if you choose to copy a link with your numbers.
Two caveats before you compare
A family is not a person. The survey's "family" is the economically dominant single person or couple in a household, plus anyone financially tied to them. In 2025 that averaged 2.53 people. If you're married, compare your joint net worth, not half of it. If you're single, know that you're being ranked against couples too. And "age" is the age of one member, the Fed's "reference person": in a couple, the man in a mixed-sex couple or the older partner in a same-sex one. The Fed says it's only a way of organising the data consistently.
It's a survey. The Fed interviewed 4,367 families in 2025 and weighted them to stand for 135 million. It works hard to get the top right: a separate sample deliberately includes wealthy families, though the Forbes 400 are left out by design. Still, every figure has a margin of error. The Fed puts the standard error on the all-family median at $6,400. And the 99th percentile within one age group rests on only a few of the surveyed families, so treat the very top of any age table as a rough guide.
Find your own percentile
The Net Worth Percentile Calculator does the lookup for you. If you just want the tables, there's median net worth by age with every survey back to 1989, and average net worth by age with the mean next to the median. For a refresher on what a percentile actually measures, we have Percentiles explained.
Sources
- Board of Governors of the Federal Reserve System (October 2026). Changes in U.S. Family Finances from 2022 to 2025: Evidence from the Survey of Consumer Finances. Federal Reserve Bulletin. scf26.pdf. Table 2 (median and mean net worth by age, housing status and net worth percentile), Table A.2 (net worth percentiles for all families), appendix A (the definition of family and reference person, families interviewed), appendix B (sampling, families represented), and the text on the under-35 and 75-and-over changes.
- Board of Governors of the Federal Reserve System. Survey of Consumer Finances 2025, summary extract public data. Our calculation of the percentiles by age, the shares with negative net worth or $1 million or more, and the share of families below the mean.
- Board of Governors of the Federal Reserve System. SCF historic tables based on internal data, in 2025 dollars. The 2019 under-35 median.
Share this post
Keep reading
Money· Oct 11, 2026· 11 min
How Much Have People Saved for Retirement by Age? (2025 Data)
Median and mean 401(k) and IRA balances by age from the Fed's 2025 survey, the 45% of families with no account at all, and why the median is the fair number.Money· Oct 11, 2026· 10 min
What Household Income Is Top 10%, 5% or 1%? (2025 Data)
The family income it takes to reach the top 10%, 5% and 1% in the Fed's 2025 survey, overall and by age, the median by age, and what counts as income.Money· Oct 10, 2026· 10 min
My Inflation Rate: Why Yours Isn't the Official Number
Your personal inflation rate depends on what you buy. How CPI weights work, a commuter vs a renter priced with BLS data, the 2026 gas spike and your raise.