Grip Strength by Age: What's Normal for Men and Women
Median grip strength peaks near 51 kg (112 lb) for men and 31 kg (68 lb) for women in their 30s. Norms by age from UK and US data, and what counts as weak.
Health & science··8 min read
Normal grip strength depends mostly on your age and sex. For men, the median best squeeze peaks at about 51 kg (112 lb) between roughly 30 and 40; for women it peaks at about 31 kg (68 lb) over the same years. From midlife it falls slowly, then faster after 60: by 70 the typical man grips about 39 to 41 kg and the typical woman 24 to 25 kg. A grip under 27 kg (60 lb) for a man or 16 kg (35 lb) for a woman counts as low muscle strength in the European sarcopenia guideline.
Those numbers come from two large reference sets: twelve British studies of 49,964 people (Dodds et al. 2014), and our own weighted percentiles from the US government's NHANES 2011 to 2014 grip test, 10,654 adults, which we worked out from the CDC's survey files for the grip strength calculator.
This is general information, not medical advice. A low reading is a reason to ask a doctor, not a diagnosis.
Grip strength by age
Here are the medians, the grip half of people your age and sex beat, from both sets of norms. Both use the best squeeze of either hand.
| Age | Men, UK | Men, US | Women, UK | Women, US |
|---|---|---|---|---|
| 20 | 40 kg | 46.6 kg | 28 kg | 30.4 kg |
| 30 | 51 kg | 50.6 kg | 31 kg | 32.3 kg |
| 40 | 50 kg | 50.7 kg | 31 kg | 31.5 kg |
| 50 | 48 kg | 48.3 kg | 29 kg | 30.5 kg |
| 60 | 45 kg | 44.9 kg | 27 kg | 28.1 kg |
| 70 | 39 kg | 40.9 kg | 24 kg | 25.2 kg |
| 80 | 32 kg | 33.8 kg | 19 kg | 20.1 kg |
UK: Dodds et al. 2014, Table 2. US: our calculation from NHANES 2011 to 2014, survey-weighted, each age pooling people up to three years either side; the US 80 row is everyone 77 and over. To convert, 1 kg is 2.2 lb, so 50 kg is about 110 lb.
From 25 to 70 the two agree within about 2 kg, which is reassuring for data gathered on different machines, in different countries, a decade or more apart. They split at the ends: at 20 and from 75 the US medians are higher.
Show the numbers
| Age | Men | Women |
|---|---|---|
| 20 | 46.6 | 30.4 |
| 25 | 49.4 | 31.2 |
| 30 | 50.6 | 32.3 |
| 35 | 51.3 | 32.2 |
| 40 | 50.7 | 31.5 |
| 45 | 48.7 | 31.0 |
| 50 | 48.3 | 30.5 |
| 55 | 46.2 | 29.4 |
| 60 | 44.9 | 28.1 |
| 65 | 43.8 | 26.9 |
| 70 | 40.9 | 25.2 |
| 75 | 38.5 | 23.9 |
| 80 | 33.8 | 20.1 |
A median is only the middle, though. The spread at any age is wide: among US men of 40, the 10th percentile is 41.8 kg and the 90th is 59.8 kg; among women of 40, 25.5 to 39.0 kg. A percentile tells you more than a pass or fail line, and the calculator gives you one.
What counts as weak
The European Working Group on Sarcopenia in Older People (EWGSOP2, Cruz-Jentoft et al. 2019) uses a grip under 27 kg for men and under 16 kg for women as low muscle strength. Those lines sit 2.5 standard deviations below the young-adult peak in the British norms. Low strength makes sarcopenia (age-related loss of muscle) "probable" in that guideline; a doctor confirms it by measuring muscle mass or quality.
Few people under 60 come anywhere near those lines. They're a floor for older adults, not a target. For most readers the useful question is where you sit for your age.
Why grip strength gets so much attention
A hand squeeze sounds like a narrow test, but in large studies it tracks overall strength and health surprisingly well. In US adults from the same NHANES years, followed for a median of 6.75 years, the weakest 20% for their sex and body size had about twice the death rate of everyone else, after adjusting for age, lifestyle and existing illness (Chai, Zhang and Fan 2024).
2.2×the death rate of everyone else, for the weakest 20% of men by grip strength (2.5× for women), after adjusting for age, lifestyle and illness.
That's an association, not a forecast. Weak grip often goes with illness or inactivity that also affect health, so squeezing a gripper every day won't buy you those odds by itself. What the link does say is that grip is a cheap, quick reading of how you're doing, and worth tracking over the years.
How to measure it
You need a hand dynamometer, the kind physiotherapists and many gyms have. A spring gripper won't do: it tells you whether you closed it, not how hard you squeezed.
The British studies mostly followed the Southampton protocol:
- Sit in a chair with arms, feet flat on the floor.
- Bend your elbow to about 90 degrees, forearm resting on the chair arm, wrist just over the end, thumb up.
- Squeeze as hard as you can for a few seconds.
- Do it three times with each hand, alternating hands, and keep the best of all six.
NHANES tested mostly standing, on a digital dynamometer. Position and device change the result by less than 10%, according to Dodds and colleagues, but if you test yourself again later, use the same set-up each time.
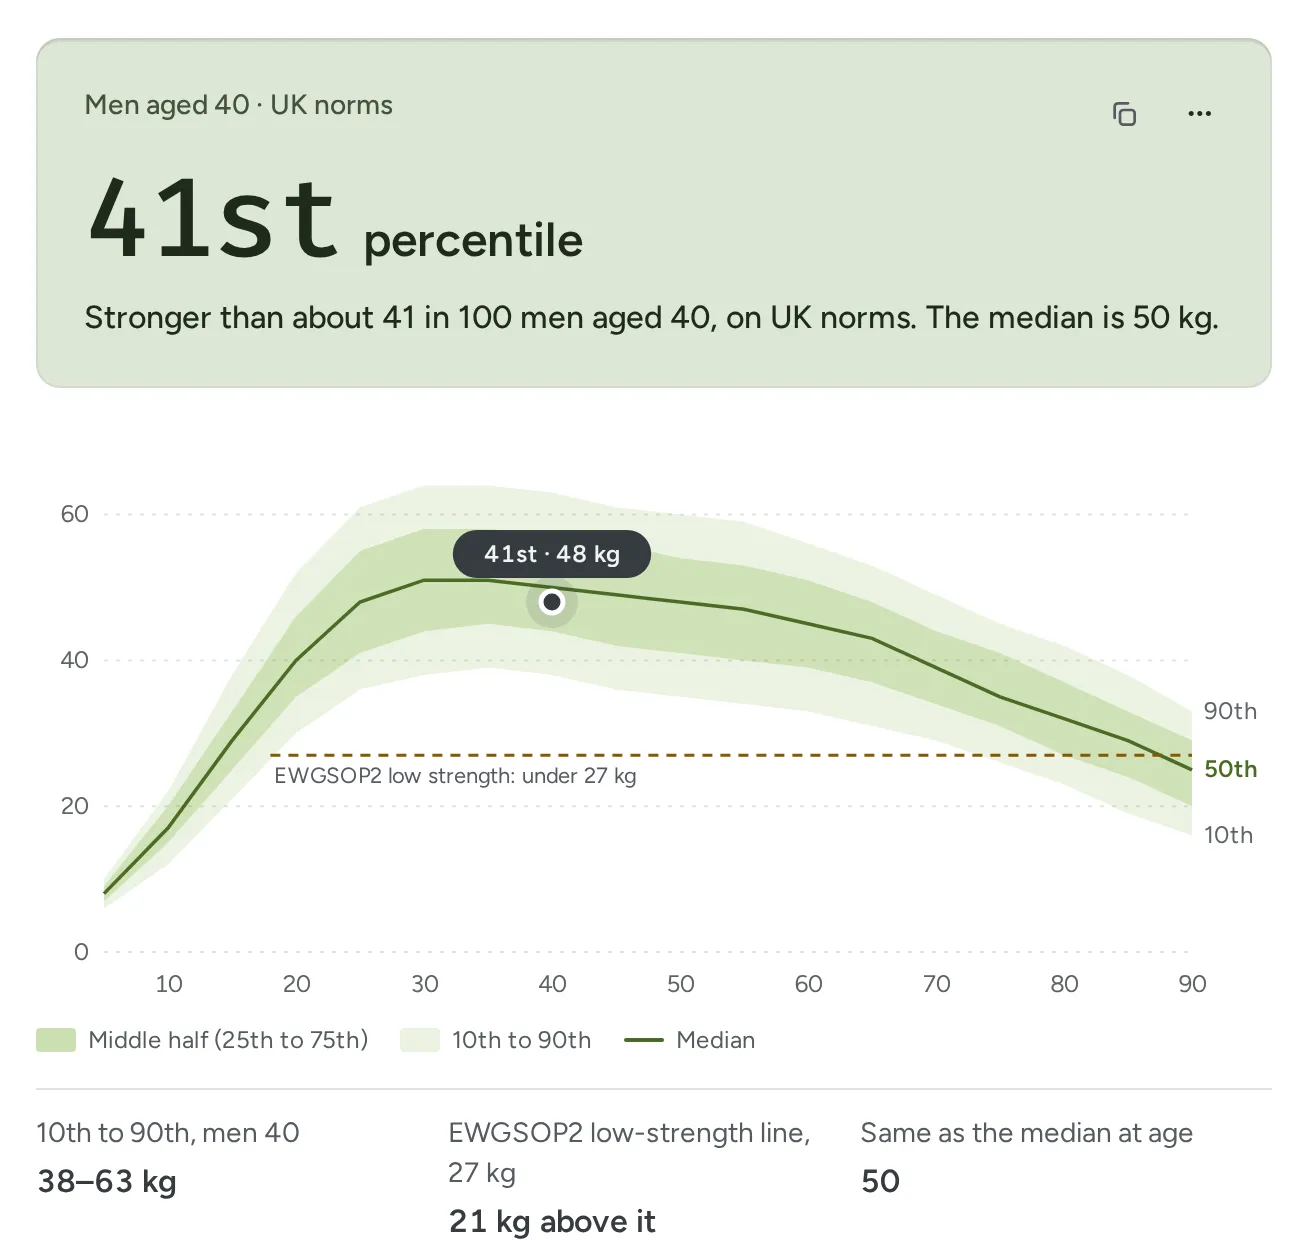
Here's the calculator's own example worked through:
- Best of six squeezes48 kg (106 lb)
- Median for men of 40: 50 kg2 kg under
- Percentile among men of 4041st35th on the US norms (median 50.7 kg)
So 48 kg is a little below the middle for 40, but well within the normal range: it's the median grip of a man of about 50 in the same norms. Nowhere near the 27 kg line.
Check yours
The grip strength calculator takes your best squeeze in kg or lb, your age and sex, and places it on either set of norms, with the centile curves and the EWGSOP2 line drawn in. You can enter each hand to see how much they differ; a gap of more than 10% counts as asymmetric in research, though on its own it wasn't linked with problems in daily life in a large US study. It all runs in your browser.
For a fuller picture, grip pairs well with a fitness reading: here's what a good VO2 max is for your age. And if you have blood test results to hand, you can turn them into a biological age.
Sources
- Dodds RM, Syddall HE, Cooper R, et al. (2014). Grip strength across the life course: normative data from twelve British studies. PLoS ONE 9(12):e113637, Table 2. CC BY 4.0.
- CDC National Center for Health Statistics. National Health and Nutrition Examination Survey 2011–2012 and 2013–2014: muscle strength (MGX_G, MGX_H) and demographics (DEMO_G, DEMO_H). Our survey-weighted percentiles, built with
scripts/build-nhanes-grip.mjs. - Cruz-Jentoft AJ, Bahat G, Bauer J, et al. (2019). Sarcopenia: revised European consensus on definition and diagnosis. Age and Ageing 48(1):16–31, Table 3.
- Chai L, Zhang D, Fan J (2024). Comparison of grip strength measurements for predicting all-cause mortality among adults aged 20+ years from the NHANES 2011–2014. Scientific Reports 14:29245, Table 4.
- Collins K, Johnson N, Klawitter L, et al. (2020). Handgrip strength asymmetry and weakness are differentially associated with functional limitations in older Americans. International Journal of Environmental Research and Public Health 17(9):3231.
Share this post
Keep reading
Health & science· Nov 14, 2026· 10 min
What Is a Good VO2 Max for My Age? Lab Norms by Age and Sex
A good VO2 max is above the median for your age and sex: 42.4 for men in their 30s, 30.2 for women. Lab-tested percentiles, and how far off watches can be.Health & science· Nov 14, 2026· 9 min
How to Calculate Your Biological Age From a Blood Test
PhenoAge turns nine routine blood results and your age into a biological age. The full Levine formula, a worked example, and which results move it most.Health & science· Oct 11, 2026· 11 min· Updated Nov 2026
How Many Calories Do You Need a Day? TDEE, Explained
Your daily calories are your resting burn times an activity multiplier. Why most calculators guess low for desk workers, why a range helps, and how to check.