How to Calculate Your Biological Age From a Blood Test
PhenoAge turns nine routine blood results and your age into a biological age. The full Levine formula, a worked example, and which results move it most.
Health & science··9 min read
The best-tested way to get a biological age from an ordinary blood test is Phenotypic Age (PhenoAge), from Morgan Levine and colleagues in 2018 (Levine et al.). It takes your age and nine results that are on most standard panels: albumin, creatinine, glucose, C-reactive protein (CRP), lymphocyte percentage, mean cell volume (MCV), red cell distribution width (RDW), alkaline phosphatase (ALP) and white blood cell count. A weighted sum of those becomes a 10-year mortality score, and the score is turned back into the age at which that risk is typical.
In the biological age calculator's example, a 50-year-old with ordinary results comes out at 42.2. Below is the full formula (most sites give you a fragment or a black box), that example worked through, which results move the answer most, and one catch that changes how you should read your own number.
This is general information, not medical advice. PhenoAge is a research measure, not a diagnosis, and your results are best discussed with whoever ordered the test.
The PhenoAge formula
The weights come from Supplementary Table S1 of the paper. Each result must be in the paper's units, which are not always the ones on a US lab report.
Step 1, the weighted sum (xb):
xb = −19.9067 − 0.0336 × albumin + 0.0095 × creatinine + 0.1953 × glucose + 0.0954 × ln(CRP) − 0.0120 × lymphocytes + 0.0268 × MCV + 0.3306 × RDW + 0.0019 × ALP + 0.0554 × white cells + 0.0804 × age
| Result | Paper's unit | From US units |
|---|---|---|
| Albumin | g/L | g/dL × 10 |
| Creatinine | µmol/L | mg/dL × 88.4 |
| Glucose | mmol/L | mg/dL ÷ 18.016 |
| C-reactive protein | mg/dL, then its natural log | mg/L ÷ 10 |
| Lymphocytes | % of white cells | already % |
| Mean cell volume | fL | already fL |
| Red cell distribution width | % | already % |
| Alkaline phosphatase | U/L | already U/L |
| White blood cells | 1000 cells/µL | already 10³/µL |
Step 2, the 10-year mortality score (M):
M = 1 − exp(−exp(xb) × (exp(120 × 0.0076927) − 1) ÷ 0.0076927)
Step 3, Phenotypic Age:
PhenoAge = 141.50225 + ln(−0.00553 × ln(1 − M)) ÷ 0.090165
Be careful copying the equation from elsewhere. A widely cited follow-up paper reprints it with typos (0.0195 for glucose, 0.3356 for RDW and 0.09165 as the divisor), so the weights in our calculator come from Levine's table only and are cross-checked against the BioAge R package to within 0.1 year.
Levine's team built the score on 9,926 adults in the US NHANES III survey (1988 to 1994) and tested it on 6,209 adults in NHANES IV with up to 12 years of follow-up. At the same calendar age, each extra year of Phenotypic Age went with a 9% higher risk of death from any cause.
A worked example
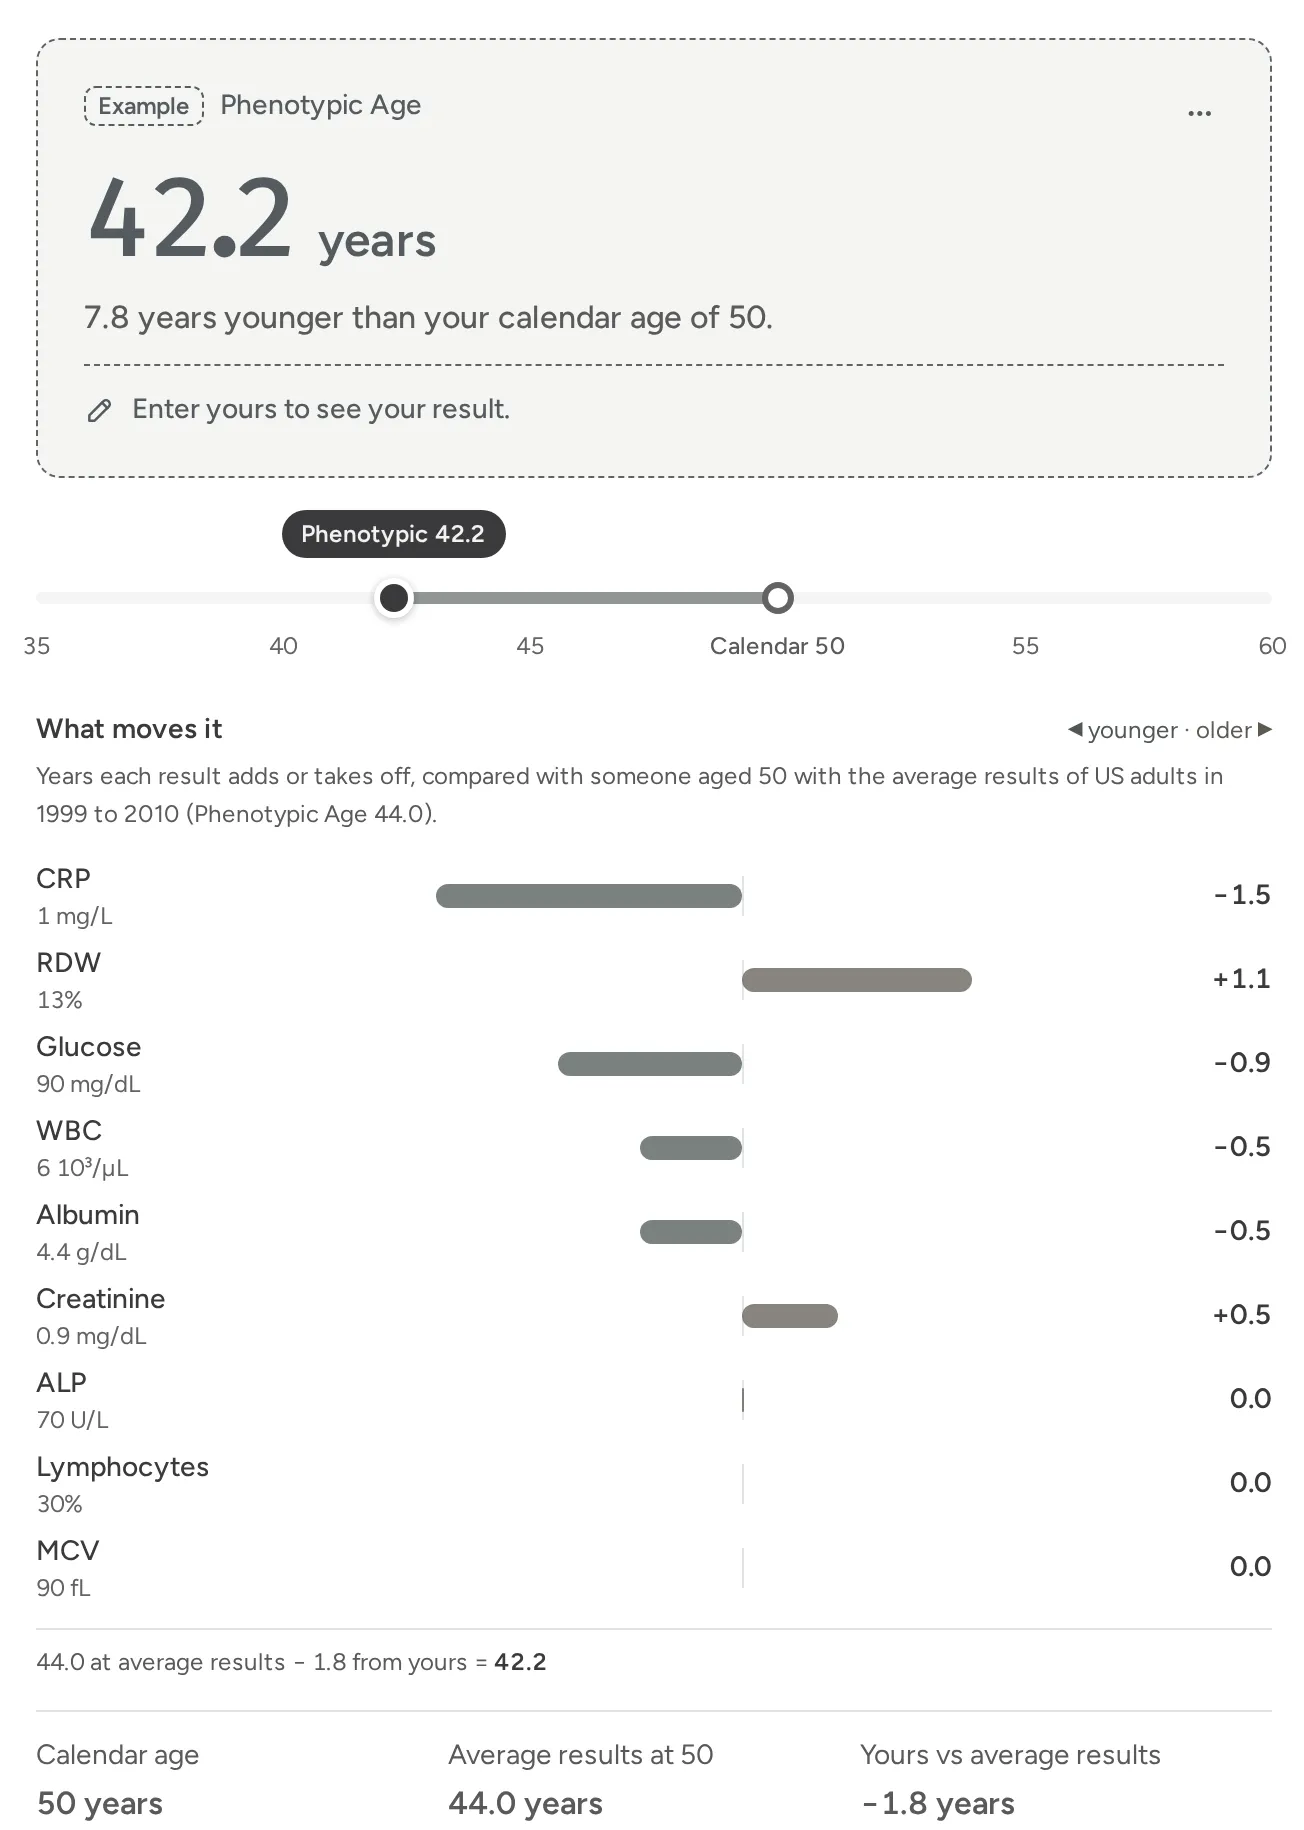
The calculator opens on a 50-year-old with these results: albumin 4.4 g/dL, creatinine 0.9 mg/dL, glucose 90 mg/dL, CRP 1 mg/L, lymphocytes 30%, MCV 90 fL, RDW 13%, ALP 70 U/L and white cells 6.0. Their mortality score works out at 2.3%, and their Phenotypic Age at 42.2.
Because the last two steps cancel to a straight line in xb, you can split the answer into pieces that add up exactly. Start with someone of the same age with the average results of US adults in NHANES IV, then add or subtract what each result does:
- Age 50 with average resultsNHANES IV means: CRP 4 mg/L, RDW 12.7%, glucose 97 mg/dL…44.0
- CRP of 1 mg/LA quarter of the average1.5
- RDW of 13%A little above the average1.1
- Glucose of 90 mg/dL5.0 mmol/L, below the average0.9
- The other six resultsWhite cells, albumin, creatinine and the rest0.5
- Phenotypic Age42.2
7.8 years youngerthan calendar age
Show the numbers
| Years | |
|---|---|
| Age 50 with average results | 44.0 |
| CRP of 1 mg/L | −1.5 |
| RDW of 13% | +1.1 |
| Glucose of 90 mg/dL | −0.9 |
| The other six results | −0.5 |
| Phenotypic Age | 42.2 |
| than calendar age | 7.8 years younger |
The catch: average results already score younger
Notice the first line of that tape. Someone of 50 with perfectly average results scores 44.0, not 50. That's not a bug in the arithmetic. The formula was fitted on blood results from 1988 to 1994, and average results in the later NHANES IV survey (1999 to 2010) come out younger at every age. At the survey's average age of 45.5, the average person scores 40.0.
Show the numbers
| Age | Calendar age | Average results |
|---|---|---|
| 20 | 20.0 | 17.2 |
| 30 | 30.0 | 26.1 |
| 40 | 40.0 | 35.1 |
| 50 | 50.0 | 44.0 |
| 60 | 60.0 | 52.9 |
| 70 | 70.0 | 61.8 |
| 80 | 80.0 | 70.7 |
So don't celebrate a few "years younger" too soon. The fairer comparison is with someone your age with average results, which is the baseline the calculator shows next to your number. In the example, 42.2 against a baseline of 44.0 is 1.8 years better than average, a more modest story than "7.8 years younger".
Which results move it most
The weights alone are hard to compare, because the results are on such different scales. A fairer view is how many years a typical difference makes: one standard deviation, the spread of each result among US adults. That's 1.1 percentage points of RDW, 27 mg/dL of glucose (1.5 mmol/L), 0.25 mg/dL of creatinine (22 µmol/L), 6 fL of MCV, 0.42 g/dL of albumin (4.2 g/L), 2,400 white cells per µL, 9.6 points of lymphocytes and 28 U/L of ALP.
Show the numbers
| Value | |
|---|---|
| RDW | 4.0 |
| Glucose | 3.3 |
| Creatinine | 2.3 |
| MCV | 1.8 |
| Albumin | 1.6 |
| White cells | 1.5 |
| Lymphocytes | 1.3 |
| ALP | 0.6 |
CRP works on a log scale, so it's counted per doubling: each doubling adds about 0.73 years, and going from 1 to 4 mg/L adds about 1.5. A few practical points follow from that:
- Get the CRP unit right. A CRP in mg/L typed as if it were mg/dL adds about 2.4 years. The calculator converts units for you and offers a fix when a value looks like it's in the wrong one.
- "<0.3" is fine. Many reports give low CRP as "less than" a number; the calculator counts it as that number, an upper bound.
- A cold can move it. CRP and white cells rise with any infection or inflammation, so a test taken while you're unwell will read older. Compare results taken when you're well.
- Some weights are about risk, not virtue. Higher albumin and lymphocytes lower the score, higher MCV and RDW raise it. These track illness and nutrition in large groups; pushing one number on its own isn't the point.
What PhenoAge is and isn't
PhenoAge is one of the better-validated blood-based measures, and it's cheap: the nine results come from tests many people already get at a check-up. But it is a mortality-risk score expressed as an age. It isn't an epigenetic clock (Levine's team also built a DNA methylation version, DNAm PhenoAge, which needs a different test), it wasn't designed to track small changes in one person over months, and the averages behind it are American.
Used sensibly, it's a way to see which of your results sit on the high-risk side of average, and to follow the trend across years of check-ups.
Work out yours
The biological age calculator takes the nine results in US or SI units, warns when one looks like it's in the wrong unit, and shows your Phenotypic Age, the baseline for your age, and a bar for each result with the years it adds or takes off. Nothing you enter leaves your browser.
Blood tests are one window. Two others take a few minutes: grip strength for your age and a good VO2 max for your age.
Sources
- Levine ME, Lu AT, Quach A, et al. (2018). An epigenetic biomarker of aging for lifespan and healthspan. Aging (Albany NY) 10(4):573–591. Supplementary Methods and Supplementary Table S1 (weights, constant, gamma); main text for the training and validation samples and the hazard ratio. CC BY 3.0.
- Liu Z, Kuo PL, Horvath S, Crimmins E, Ferrucci L, Levine M (2018). A new aging measure captures morbidity and mortality risk across diverse subpopulations from NHANES IV. PLoS Medicine 15(12):e1002718, S1 Table (means and standard deviations of 11,432 adults). CC0.
- Kwon D, Belsky DW. BioAge R package, used to cross-check the calculator's results.
Share this post
Keep reading
Health & science· Nov 14, 2026· 10 min
What Is a Good VO2 Max for My Age? Lab Norms by Age and Sex
A good VO2 max is above the median for your age and sex: 42.4 for men in their 30s, 30.2 for women. Lab-tested percentiles, and how far off watches can be.Health & science· Nov 14, 2026· 8 min
Grip Strength by Age: What's Normal for Men and Women
Median grip strength peaks near 51 kg (112 lb) for men and 31 kg (68 lb) for women in their 30s. Norms by age from UK and US data, and what counts as weak.Health & science· Oct 24, 2026· 16 min· Updated Nov 2026
A1C Chart: A1C to Average Glucose, and What's Normal
An A1C of 7% means an average glucose of about 154 mg/dL. The full A1C chart in mg/dL, mmol/L and mmol/mol, with the normal and prediabetes ranges.