A1C Chart: A1C to Average Glucose, and What's Normal
An A1C of 7% means an average glucose of about 154 mg/dL. The full A1C chart in mg/dL, mmol/L and mmol/mol, with the normal and prediabetes ranges.
Health & science··16 min read
An A1C of 7% means your blood sugar averaged about 154 mg/dL (8.6 mmol/L) over roughly the last three months, and each extra percentage point adds about 29 mg/dL. For diagnosis, an A1C below 5.7% is normal, 5.7% to 6.4% is prediabetes, and 6.5% or above is in the diabetes range (ADA Standards of Care 2026; CDC).
Below is the full chart in all three units, then where the formula comes from, why your meter's average often doesn't match it, how a sensor's GMI fits in, and how often the test is done.
This is general information, not medical advice. Only a lab test can diagnose diabetes, and your own A1C target is one to set with your care team.
The A1C chart
Every value here comes from one formula, from the A1C-Derived Average Glucose (ADAG) study (Nathan et al., 2008):
estimated average glucose (mg/dL) = 28.7 × A1C − 46.7
The result is called the eAG, for estimated average glucose. To get mmol/L, divide the mg/dL figure by 18. The third unit, mmol/mol, is how the IFCC (the international lab standard) reports A1C, and it's what you'll see on results in many countries outside the US (NGSP). It's worked out as (A1C % − 2.15) × 10.929, the NGSP's master equation rearranged.
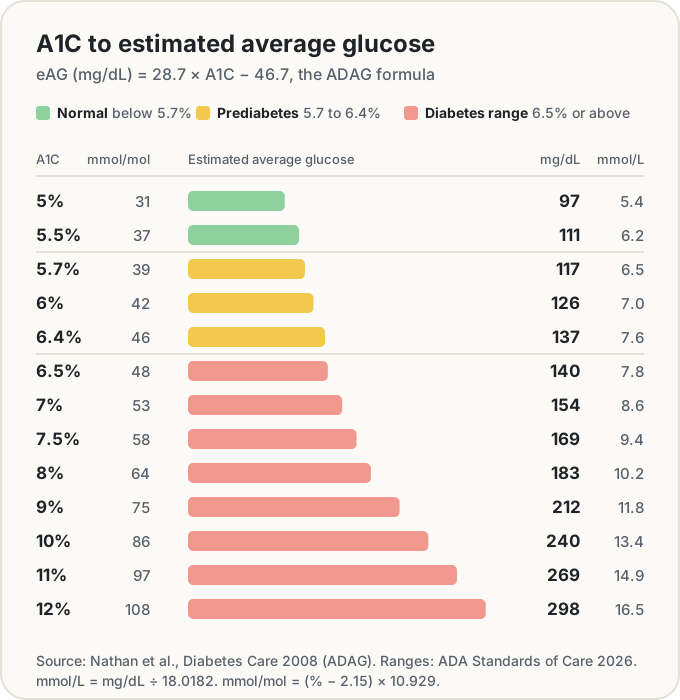
The same chart as a table, with a few extra rows. The middle two columns are the eAG:
| A1C % | mmol/mol | mg/dL | mmol/L | Range |
|---|---|---|---|---|
| 4.5 | 26 | 82 | 4.6 | Normal |
| 5.0 | 31 | 97 | 5.4 | Normal |
| 5.5 | 37 | 111 | 6.2 | Normal |
| 5.7 | 39 | 117 | 6.5 | Prediabetes |
| 6.0 | 42 | 126 | 7.0 | Prediabetes |
| 6.4 | 46 | 137 | 7.6 | Prediabetes |
| 6.5 | 48 | 140 | 7.8 | Diabetes |
| 7.0 | 53 | 154 | 8.6 | Diabetes |
| 7.5 | 58 | 169 | 9.4 | Diabetes |
| 8.0 | 64 | 183 | 10.2 | Diabetes |
| 8.5 | 69 | 197 | 11.0 | Diabetes |
| 9.0 | 75 | 212 | 11.8 | Diabetes |
| 9.5 | 80 | 226 | 12.6 | Diabetes |
| 10.0 | 86 | 240 | 13.4 | Diabetes |
| 11.0 | 97 | 269 | 14.9 | Diabetes |
| 12.0 | 108 | 298 | 16.5 | Diabetes |
| 13.0 | 119 | 326 | 18.1 | Diabetes |
| 14.0 | 130 | 355 | 19.7 | Diabetes |
These are the values in the ADAG paper's own table. Other charts sometimes differ by 1 mg/dL or 0.1 mmol/L, because they round differently or divide by a slightly different factor (18.016 instead of 18). A difference that small doesn't change what the number means.
What A1C actually measures
Glucose in your blood sticks to haemoglobin, the protein in red blood cells. The A1C test (also written HbA1c, or called glycated haemoglobin) measures what share of your haemoglobin has glucose attached. The more glucose there has been around, the higher the share.
Red blood cells are replaced about every three months, so the result reflects your average over roughly that stretch (CDC; NIDDK). That's both the strength and the limit of the test. It's steady: the ADA's comparison of A1C with glucose tests notes that A1C is a non-fasting test that varies little within a person, unaffected by recent food, stress, illness or activity (ADA, Table 2.3). But it's one number for three months, so it can't show highs, lows or when they happened.
The eAG is the same result translated into the units your meter uses. NIDDK makes the point that it won't match any single day's readings, because it's a long-term average.
Normal, prediabetes and diabetes ranges
These are the diagnostic cut-offs in the ADA's Standards of Care in Diabetes 2026 (Tables 2.1 and 2.2), the same ones the CDC and NIDDK use:
| Result | A1C (%) | A1C (mmol/mol) | eAG at the cut-off |
|---|---|---|---|
| Normal | below 5.7 | below 39 | under 117 mg/dL |
| Prediabetes | 5.7 to 6.4 | 39 to 47 | 117 to 137 mg/dL |
| Diabetes | 6.5 or above | 48 or above | 140 mg/dL and up |
A few rules sit behind that table:
- One high result isn't a diagnosis. Without clear signs of high blood sugar, the ADA requires two abnormal results to confirm diabetes: two different tests taken at the same time (an A1C and a fasting glucose, say), or the same test repeated later (ADA, Table 2.1; NIDDK).
- The lab method matters. For diagnosis, the test should use a method certified by the National Glycohemoglobin Standardization Program (NGSP), and point-of-care devices should only be used if they're FDA-approved for diagnosis and run in a certified lab (recommendations 2.2a and 2.2b).
- The cut-offs don't change with sex. The ADA's criteria are the same numbers for men and women, so "normal A1C for a woman" has the same answer as for a man: below 5.7%.
Targets once you have diabetes
A diagnostic cut-off and a treatment goal are different things. Once someone has diabetes, the ADA's section on glycemic goals sets out a general goal and when to move it:
- Under 7% (53 mmol/mol) is appropriate for many nonpregnant adults, as long as it can be reached without significant hypoglycaemia (recommendation 6.3a).
- Lower, such as under 6.5% (48 mmol/mol), may suit people in good health for whom the treatment carries little risk or burden, such as low risk of hypoglycaemia (6.4).
- Less stringent goals, the ADA's example being up to 8% (64 mmol/mol), may suit people with significant cognitive or functional limitations, frailty or severe other illness, or where the harms of tighter treatment outweigh the benefits (6.5).
- Pregnancy has its own targets and its own caveats, covered in a separate section.
Which of these applies to a given person is exactly the kind of decision a chart can't make. It depends on their health, their treatment and their risk of lows, and it's a conversation with their care team.
A worked example
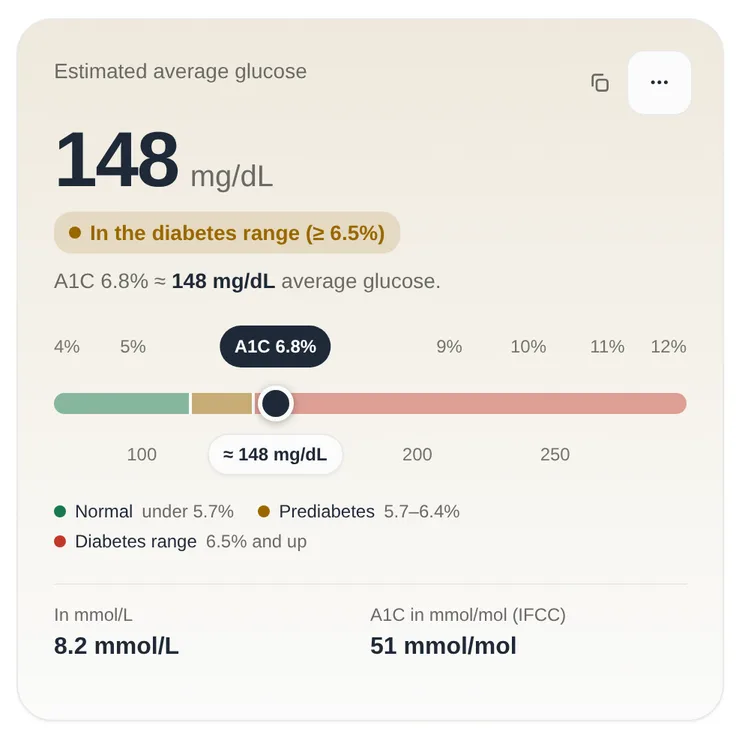
Say a lab result comes back at 6.8%, which sits between two rows of the chart.
- Multiply by 28.7. 28.7 × 6.8 = 195.16.
- Subtract 46.7. 195.16 − 46.7 = 148.46, so the eAG is about 148 mg/dL.
- Convert to mmol/L. 148.46 ÷ 18 = 8.25, about 8.2 mmol/L.
- Convert to mmol/mol. (6.8 − 2.15) × 10.929 = 4.65 × 10.929 = 50.8, about 51 mmol/mol.
- Place it. 6.8% is above the 6.5% cut-off, so on a lab test it falls in the diabetes range, and it's under the 7% goal the ADA gives for many adults.
The same sum runs backwards for a glucose average: A1C = (average mg/dL + 46.7) ÷ 28.7. An average of 183 mg/dL gives (183 + 46.7) ÷ 28.7 = 229.7 ÷ 28.7 = 8.0%.
Our glucose to A1C converter does both directions as you type, in mg/dL or mmol/L and % or mmol/mol, and shows the working under the result.
Why your meter or CGM average doesn't match the chart
A meter's average and the eAG often disagree, and there are three separate reasons.
The formula is an average across people
The ADAG study followed 507 adults with type 1 diabetes, type 2 diabetes or no diabetes for three months. Each wore a continuous glucose monitor for at least two days every four weeks and did seven-point finger-stick profiles at least three days a week, about 2,700 glucose values per person (Nathan et al., 2008). The straight line through all of them fitted well (R² = 0.84), but people still sat above and below it.
The paper gives the spread directly. At an A1C of 7%, the estimated average is 154 mg/dL, with a 95% range of 123 to 185 mg/dL. About 90% of the measurements were within 15% of the formula's figure.
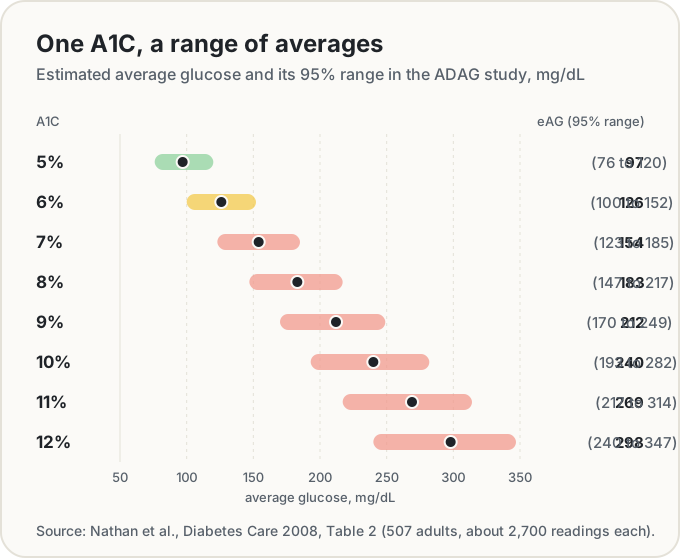
So two people with the same 7% can have true averages 60 mg/dL apart, and neither result is wrong. Researchers put much of this down to differences in how long each person's red blood cells live and how readily glucose attaches to their haemoglobin (Bergenstal et al., 2018).
Finger-sticks catch moments, not the day
A meter average is the average of the moments you tested. If most readings are on waking and before meals, the peaks after eating are missing, and the meter average comes out lower than your true average. We went into this in time in range explained. The ADA also notes that A1C and meter or sensor results can disagree when glucose swings a lot during the day, and suggests looking at both in that case (ADA, section 6).
Some conditions change the A1C itself
Because A1C depends on red blood cells and haemoglobin, anything that changes them can push the result up or down without your glucose changing. The ADA, NGSP and NIDDK list these:
- Anaemia. Iron-deficiency anaemia is linked to a higher A1C, and iron treatment lowers it (NGSP; NIDDK). Anything that shortens red cell survival, such as haemolytic anaemia or recovery from blood loss, falsely lowers it whatever lab method is used (NGSP).
- Recent blood transfusion. Named by the ADA among the conditions that affect red cell turnover and A1C accuracy (section 6), and by NIDDK.
- Pregnancy. "Due to physiological increases in red blood cell turnover, A1C levels fall during normal pregnancy," so the ADA uses it as a secondary measure in pregnancy, after glucose monitoring (ADA, section 15). Late in pregnancy, iron deficiency can push A1C up again (NGSP).
- Some haemoglobin variants. Traits such as HbS (sickle cell trait), HbC, HbE and HbD interfere with some A1C methods and not others (NGSP). The ADA says most US assays are accurate for the common single-copy variants, but A1C can't be measured at all in sickle cell disease (HbSS) or other variants inherited from both parents (section 6). NIDDK notes these variants are more common in people with African, Mediterranean or Southeast Asian heritage.
- Kidney disease. Kidney failure is on the ADA's list (section 6). The NGSP adds that a chemically changed haemoglobin found in kidney failure can affect some methods, and that reports suggest A1C underestimates glucose in people on dialysis (NGSP).
The ADA's list also includes G6PD deficiency, HIV, liver disease (cirrhosis) and treatment with erythropoietin (ADA, section 2). Where any of these apply, the ADA recommends diagnosing with plasma glucose tests instead (recommendation 2.4), and for monitoring it points to meter or sensor glucose, or other blood tests such as fructosamine (section 6).
GMI: the sensor's version of the number
If you wear a continuous glucose monitor (CGM), its report shows a GMI, the glucose management indicator. It does the opposite job to eAG: it turns your average sensor glucose into an A1C-style percentage.
GMI (%) = 3.31 + 0.02392 × average glucose (mg/dL)
It comes from 528 people who wore sensors in four clinical trials, and the authors recommend 14 or more days of data, 10 at the very least (Bergenstal et al., 2018). It used to be called "estimated A1C", and the name was changed on purpose: GMI and a lab A1C often disagree, and the old name implied they shouldn't. In the study, they were within 0.1 points for only 19% of people, 0.5 points or more apart for 28%, and 1 point or more apart for 3%. The ADA describes GMI as a value "approximating A1C (not always equivalent)" (section 6, Table 6.2).
The two formulas also disagree with each other. They meet at about 154 mg/dL, where both give 7.0%, and drift apart on either side:
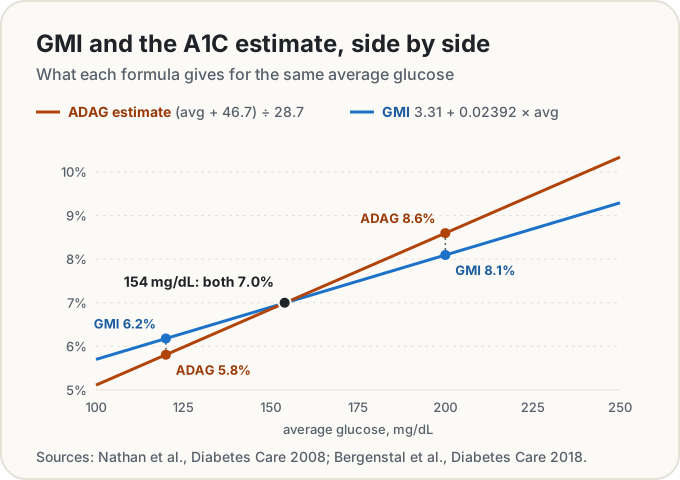
Take the 183 mg/dL average from the worked example. The ADAG formula gives 8.0%. GMI gives 3.31 + 0.02392 × 183 = 3.31 + 4.38 = 7.7%. Same average, two numbers 0.3 apart, and a lab A1C could differ from both.
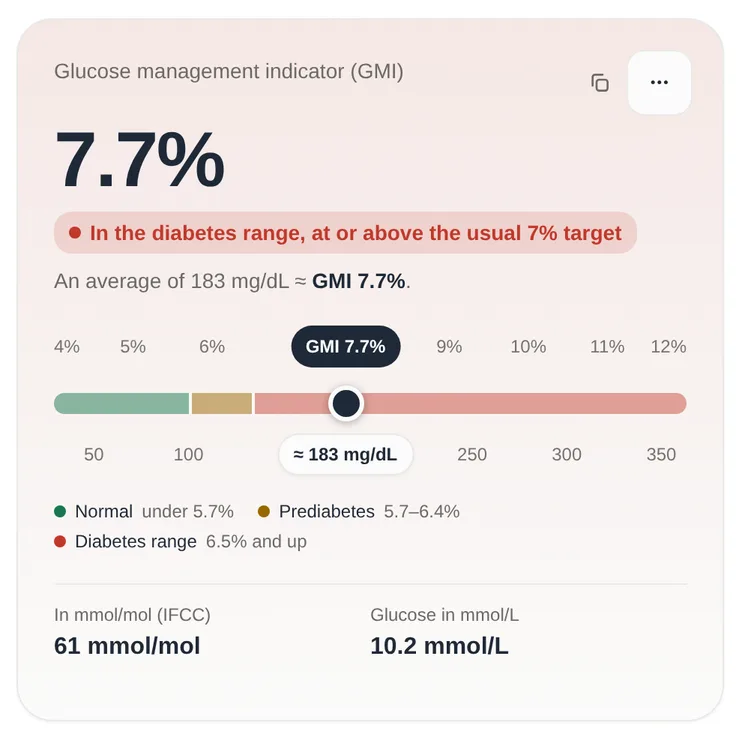
If your GMI and lab A1C keep differing by about the same amount, that gap is worth showing your care team rather than a sign that one of them is broken. The AGP report puts GMI next to the rest of your sensor data on one page.
How often A1C is tested
The ADA's 2026 Standards set these intervals:
- Screening without symptoms starts at age 35 for everyone, and at any age for adults with overweight or obesity and one or more risk factors (recommendations 2.12a and 2.12b). If results are normal, repeating at least every 3 years is reasonable, sooner if symptoms or risk change (2.12c).
- With prediabetes, testing yearly (ADA, Table 2.5). The CDC's patient page says a doctor will likely suggest every 1 to 2 years.
- With diabetes, at least twice a year, and more often, such as every 3 months, for people who aren't meeting their goals, whose treatment recently changed, or who have frequent or severe highs or lows (recommendation 6.2).
Check your own numbers
The glucose to A1C converter turns any A1C into an average glucose and back, with a GMI mode for sensor averages and a printable chart. If you test with a meter, the blood sugar log keeps your readings and works out your average and estimated A1C once there are at least 14 readings on 7 different days, or GMI if you import sensor data. Both run in your browser with no account, and your numbers aren't uploaded.
Frequently asked questions
Is an A1C of 5.7% bad?
5.7% is where the prediabetes range starts (ADA; CDC). It isn't diabetes, and it's an estimated average of about 117 mg/dL. It's a reason to retest on the schedule your doctor suggests, which the ADA puts at yearly for prediabetes.
What is a normal A1C for someone without diabetes?
Below 5.7% (39 mmol/mol). That's an estimated average glucose under about 117 mg/dL (6.5 mmol/L).
Do I need to fast for an A1C test?
No. The ADA lists it as a non-fasting test that needs no preparation, and it isn't affected by recent food, stress, illness or activity (Table 2.3). If your appointment includes other blood tests, those may still need fasting.
Is HbA1c the same as A1C?
Yes. A1C, HbA1c, haemoglobin A1c and glycated haemoglobin are names for the same test. US labs report it as a percentage; many other countries report mmol/mol, or both (NGSP).
Is there an A1C chart by age?
Not for diagnosis: the ADA's cut-offs are the same numbers at every adult age. What can change with age and health is the treatment goal for someone who has diabetes, which the ADA allows to be less stringent with frailty or serious other illness (section 6). That's set person by person.
Can an A1C result be wrong?
The test can be accurate and still not reflect your glucose, because anaemia, recent blood loss or transfusion, pregnancy, some haemoglobin variants and kidney disease change the A1C itself. If your A1C and your glucose readings tell different stories, mention it: there are other tests for exactly this.
Sources
- American Diabetes Association Professional Practice Committee for Diabetes (2026). 2. Diagnosis and classification of diabetes: Standards of Care in Diabetes 2026. Diabetes Care, 49(Suppl. 1), S27 to S49. doi:10.2337/dc26-S002. Tables 2.1, 2.2, 2.3 and 2.5; recommendations 2.2a, 2.2b, 2.4 and 2.12a to c.
- American Diabetes Association Professional Practice Committee for Diabetes (2026). 6. Glycemic goals, hypoglycemia, and hyperglycemic crises: Standards of Care in Diabetes 2026. Diabetes Care, 49(Suppl. 1), S132 to S149. doi:10.2337/dc26-S006. Recommendations 6.2 to 6.5, A1C limitations, discordance and Table 6.2.
- American Diabetes Association Professional Practice Committee for Diabetes (2026). 15. Management of diabetes in pregnancy: Standards of Care in Diabetes 2026. Diabetes Care, 49(Suppl. 1), S321 to S338. doi:10.2337/dc26-S015.
- Nathan, D. M., et al. (2008). Translating the A1C assay into estimated average glucose values. Diabetes Care, 31(8), 1473 to 1478. PMC2742903. The formula, the study design, Table 2 and the spread.
- Bergenstal, R. M., et al. (2018). Glucose Management Indicator (GMI): a new term for estimating A1C from continuous glucose monitoring. Diabetes Care, 41(11), 2275 to 2280. PMC6196826.
- Centers for Disease Control and Prevention. A1C test for diabetes and prediabetes (May 2024).
- National Institute of Diabetes and Digestive and Kidney Diseases. The A1C test and diabetes.
- NGSP. IFCC standardization of HbA1c (the master equation) and Factors that interfere with HbA1c test results.
Share this post
Keep reading
Health & science· Oct 7, 2026· 9 min
Time in Range Explained: What 70–180 mg/dL Means
What blood sugar time in range measures, the international consensus targets, how it lines up with A1C and GMI, and what finger-stick readings can tell you.Health & science· Oct 7, 2026· 8 min
How to Read an AGP Report, Step by Step
A walk through the one-page ambulatory glucose profile (AGP) from a CGM: data check, time in ranges, glucose metrics, the percentile curve and daily views.Health & science· Oct 14, 2026· 13 min
How Is Your Due Date Calculated? LMP, Scans and IVF
How a due date is worked out: Naegele's 280-day rule, adjusting for cycle length, when a scan changes the date, IVF transfers and how few babies arrive on it.