Time in Range Explained: What 70–180 mg/dL Means
What blood sugar time in range measures, the international consensus targets, how it lines up with A1C and GMI, and what finger-stick readings can tell you.
Health & science··9 min read
Two people can walk out of the clinic with the same A1C of 7% and have had very different months. One spent most days between 100 and 160 mg/dL. The other swung from lows in the night to 250 after dinner, and the average happened to land in the same place.
A1C can't tell those two apart. Time in range can. It answers a plainer question: how much of the day was my glucose where I want it to be?
This guide explains what the number means, where the targets come from, how it relates to A1C and GMI, and what it can and can't tell you if you test with finger-sticks rather than a sensor.
What time in range measures
Time in range (TIR) is the share of glucose readings between 70 and 180 mg/dL (3.9–10.0 mmol/L). With a continuous glucose monitor (CGM), that share is a share of the day, so it converts neatly into time:
- 1% of a day is about 15 minutes (14.4, to be exact).
- 70% is 16 hours 48 minutes.
- 4% is just under an hour.
That conversion is the point of the metric. "You were in range for 17 hours a day" is easier to picture than an average, and easier to act on than a lab value that moves once a quarter.
The consensus targets
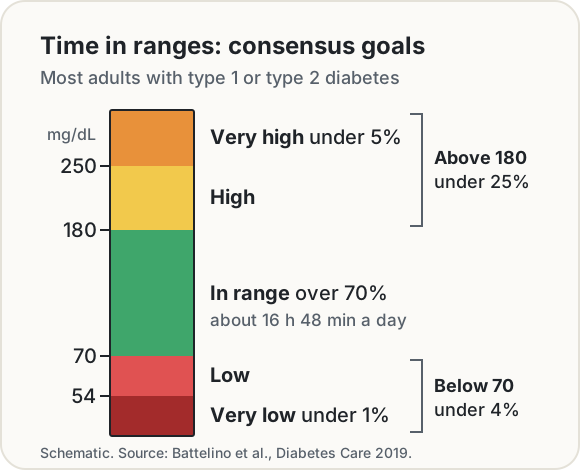
In February 2019, an international panel convened at the Advanced Technologies & Treatments for Diabetes (ATTD) congress agreed on standard ranges and goals for CGM data, published in Diabetes Care (Battelino et al., 2019). They split the day into five bands:
| Band | mg/dL | mmol/L | Goal for most adults with type 1 or type 2 |
|---|---|---|---|
| Very high | over 250 | over 13.9 | under 5% (about 1 h 12 min) |
| High | 181–250 | 10.1–13.9 | under 25% above 180, counting the very high time |
| In range | 70–180 | 3.9–10.0 | over 70% (about 16 h 48 min) |
| Low | 54–69 | 3.0–3.8 | under 4% below 70, counting the very low time |
| Very low | under 54 | under 3.0 | under 1% (about 15 min) |
The goals nest: "under 4% below 70" includes the time below 54, and "under 25% above 180" includes the time above 250. That's why the International Diabetes Center's AGP report shows two totals beside the bar: time below range and time above range.
The panel set different goals for some groups:
- Older adults or people at higher risk of lows: over 50% in range, under 1% below 70 and under 10% above 250. The panel's stated aim here is reducing lows, with less emphasis on keeping glucose in the target range.
- Pregnancy with type 1 diabetes: a tighter range of 63–140 mg/dL (3.5–7.8 mmol/L), with over 70% in range, under 4% below 63 and under 1% below 54.
The American Diabetes Association uses the same numbers. Its 2025 Standards of Care say a time in range above 70% is an appropriate goal for many nonpregnant adults using CGM, alongside under 4% of time below 70 mg/dL (under 1% for older adults) and under 1% below 54 mg/dL. Those are population goals. Your care team may set different ones for you, and in pregnancy they usually will.
Time in range and A1C
The two numbers are related but not interchangeable. The consensus paper pulls together the studies that compared them:
- A time in range of 70% corresponded to an A1C of about 7%.
- A time in range of 50% corresponded to an A1C of about 8%.
- Each extra 10 percentage points in range (about 2.4 hours a day) went with roughly 0.5 percentage points lower A1C, though one analysis found closer to 0.8.
What A1C misses is the shape of the day. The ADA's Standards put it plainly: A1C "does not provide a measure of glycemic variability or hypoglycemia." It can also be thrown off by conditions that change how quickly red blood cells are replaced, and it can't be measured at all in sickle cell disease.
There is also evidence that time in range tracks long-term risk. Roy Beck and colleagues went back to the Diabetes Control and Complications Trial (DCCT), where 1,440 people with type 1 diabetes had a seven-point finger-stick profile (before and 90 minutes after each meal, and at bedtime) taken on one day every three months. For every 10 percentage points lower time in range, the rate of retinopathy progression rose by 64% and the rate of developing microalbuminuria (an early sign of kidney damage) rose by 40% (Beck et al., 2019). That's an association in trial data, not a prediction for any one person, but it was the authors' main argument for accepting time in range as an outcome in clinical trials.
GMI: an A1C estimate from sensor data
If you wear a CGM, your report probably also shows a GMI, the glucose management indicator. It turns your average sensor glucose into an A1C-style percentage:
The formula comes from 528 people with diabetes who wore Dexcom sensors for up to 91 days (Bergenstal et al., 2018). It used to be called "estimated A1C", and the name was changed on purpose: GMI and the lab A1C often disagree, and calling both "A1C" confused people. In the study, the two were within 0.1 percentage points for only 19% of people, and differed by 0.5 points or more for 28%. The authors put much of the gap down to individual differences in red blood cell lifespan and how readily glucose attaches to haemoglobin.
The older formula you'll see for finger-stick averages is the ADAG one (Nathan et al., 2008), built from 507 people: estimated A1C = (average mg/dL + 46.7) ÷ 28.7. The two formulas agree around 154 mg/dL and drift apart away from it:
| Average glucose | GMI | ADAG estimate |
|---|---|---|
| 120 mg/dL (6.7 mmol/L) | 6.2% | 5.8% |
| 154 mg/dL (8.6 mmol/L) | 7.0% | 7.0% |
| 180 mg/dL (10.0 mmol/L) | 7.6% | 7.9% |
Neither is a lab test. If GMI and your lab A1C keep disagreeing by the same amount, that difference is useful information for your care team, not a sign that one of them is wrong. Our glucose to A1C converter shows both directions if you want to check a number.
Finger-sticks vs a sensor
The consensus targets were written for CGM data, and they come with a data requirement: at least 14 days of sensor wear, with the sensor active at least 70% of that time. Below that, the percentages can swing with one unusual day.
A finger-stick log is a different kind of data, and it's worth being honest about how:
- It's a share of readings, not a share of the day. If you test four times a day, each reading stands for six hours you didn't see. A sensor that records every 5 minutes logs 288 readings a day.
- The readings cluster. If you mostly test on waking and before meals, the peaks an hour after eating and any dips at 3am go unrecorded. The percentage only describes the moments you tested.
- It still means something if you're consistent. The DCCT analysis above used structured seven-point profiles, not sensors. If you test at the same times each week, your own percentage going up or down over a month is real information about those times of day.
So read a finger-stick time in range as "how my readings at these times compare", not "how many hours I spent in range". Our blood sugar log labels it as low confidence for exactly this reason, and switches to sensor-style time in range and GMI when you import CGM data from Dexcom Clarity, LibreView or Nightscout.
Reading your own number
A few habits make time in range more useful:
- Look at the low end first. Time below 70 is where the goals are strictest, and it's the part most worth raising with your care team if it's above the goal.
- Compare like with like. Two weeks against the previous two weeks, with the same device and the same kind of days.
- Use it with the curve, not instead of it. The percentage tells you how much time; the ambulatory glucose profile tells you when.
- Move the band only on advice. The log lets you set your own range, because care teams do set different targets in pregnancy, for children and for older adults.
None of this replaces your care team. Time in range is a way to see your data clearly and bring better questions to an appointment. Decisions about medication or treatment belong with the people who know your history, and if a reading worries you, contact them.
Try it
The blood sugar log works out your average, time in range in all five bands, variability and estimated A1C (or GMI from sensor data) as you add readings, with a printable one-page report for appointments. Everything stays in your browser.
Sources
- Battelino, T., et al. (2019). Clinical targets for continuous glucose monitoring data interpretation: recommendations from the international consensus on time in range. Diabetes Care, 42(8), 1593–1603. PMC6973648
- American Diabetes Association Professional Practice Committee (2025). 6. Glycemic goals and hypoglycemia: Standards of Care in Diabetes—2025. Diabetes Care, 48(Suppl. 1), S128–S145. PMC11635034
- Beck, R. W., et al. (2019). Validation of time in range as an outcome measure for diabetes clinical trials. Diabetes Care, 42(3), 400–405. PMC6905478
- Bergenstal, R. M., et al. (2018). Glucose Management Indicator (GMI): a new term for estimating A1C from continuous glucose monitoring. Diabetes Care, 41(11), 2275–2280. PMC6196826
- Nathan, D. M., et al. (2008). Translating the A1C assay into estimated average glucose values. Diabetes Care, 31(8), 1473–1478. PMC2742903
- International Diabetes Center. AGP Report: Continuous Glucose Monitoring, v5.0. agpreport.org
Keep reading
Health & science · Oct 7, 2026 · 8 min
How to Read an AGP Report, Step by Step
A walk through the one-page ambulatory glucose profile (AGP) from a CGM: data check, time in ranges, glucose metrics, the percentile curve and daily views.
Health & science · Oct 7, 2026 · 8 min
Tabata vs HIIT: What the Original Study Did and How to Time It
What the 1996 Tabata study actually tested, how gym Tabata differs, and how to time Tabata, 30/30, EMOM, boxing rounds and sprint intervals safely.
Health & science · Jul 18, 2026 · 3 min
How to Measure Penis Size: Bone-Pressed vs Non-Bone-Pressed
A clinical guide to measuring penile length and girth the way research studies do, including the bone-pressed vs non-bone-pressed difference.
Health & science · Oct 7, 2026 · 8 min
How to Read an AGP Report, Step by Step
A walk through the one-page ambulatory glucose profile (AGP) from a CGM: data check, time in ranges, glucose metrics, the percentile curve and daily views.
Health & science · Oct 7, 2026 · 8 min
Tabata vs HIIT: What the Original Study Did and How to Time It
What the 1996 Tabata study actually tested, how gym Tabata differs, and how to time Tabata, 30/30, EMOM, boxing rounds and sprint intervals safely.
Health & science · Jul 18, 2026 · 3 min
How to Measure Penis Size: Bone-Pressed vs Non-Bone-Pressed
A clinical guide to measuring penile length and girth the way research studies do, including the bone-pressed vs non-bone-pressed difference.